Monitor Postgres DB in AWS RDS
Overview
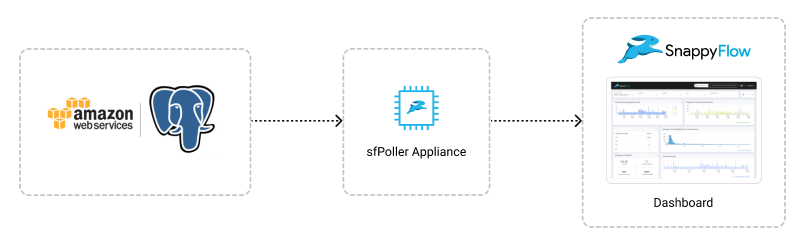
The metrics of Postgres DB running in AWS are gathered by sfPoller and displayed within the dashboard of SnappyFlow.
Prerequisites
To collect metrics of Postgres DB hosted on AWS, it is necessary to have a sfpoller set up within your AWS environment.
Click here to learn more about setting up sfpoller in your AWS environment.
Configure sfPoller
Ensure that both the project and application are created within sfPoller. If they have not been created yet, you can click here to learn how to create a project and application in sfPoller.
Follow the below step to add endpoints and plugins:
In the Application tab of sfPoller, navigate to your Project > Application.
Click on the Application, it will take you to the
Endpointpage.Click the
Add Endpointbutton, add the following data, and save.Account Type: Select account type as AWS
Account Name: Name of the AWS account
Endpoint Type: Postgres
Name: Give a meaningful name to the endpoint
IP: Add the application IP address
In the Plugins window, click the
+Addbutton.In the Add Plugin window, select the below details and save.
- Plugin Type:
Metric - Plugin:
Postgres - Interval: Choose an interval value. The minimum value for the interval is 300
- Plugin Type:
Click the global
Savebutton in the window's top right corner to save all the changes made so far.
Replication
PostgreSQL includes built-in binary replication based on shipping the changes write ahead logs(WAL) to replica nodes asynchronously, with the ability to run read-only queries against these replicated nodes. This allows splitting read traffic among multiple nodes efficiently.
PostgreSQL includes built-in synchronous replication that ensures that, for each write transaction, the master waits until at least one replica node has written the data to its transaction log. This can be useful for workloads that do not require such guarantees, and may not be wanted for all data as it slows down performance due to the requirement of the confirmation of the transaction reaching the synchronous standby.
Replication is supported only on AWS RDS PostgreSQL versions between 10 and 13.
User with root access is required to collect replication metrics from PostgreSQL.
View Database Metrics
Follow the below steps to view the metrics collected from Postgres DB.
Go to the Application tab in SnappyFlow and navigate to your Project > Application > Dashboard.
You can view the database metrics in the Metrics section.
noteOnce plugins are added to sfPoller, they will be automatically detected within the Metrics section. However, if the plugins are not detected, you can import templates to view the corresponding metrics.
To access the unprocessed data gathered from the plugins, navigate to the Browse data section and choose the
Index: Metric,Instance: Endpoint,Plugin,andDocument Type.
Template Details
| Template | Plugins | Document Type |
|---|---|---|
| PostgreSQL | postgres | serverDetails, databaseDetails, tableDetails, indexDetails, queryDetails |
| PostgreSQL_Replication | postgres | masterReplicationDetails, replicationSlotDetails, slaveReplicationDetails |
Metrics list
Server Details
| Metric | Description |
|---|---|
| numCreatedTempFiles | Total number of temporary files created . |
| numTransactions | Total number of transactions that have been committed and rolled back. |
| archiveFailCount | Number of failed attempts for archiving WAL files. |
| activeProcesses | Number of active process running in the server. |
| archivedCount | Number of WAL files that have been successfully archived. |
| numUpdate | Total number of rows updated by queries. |
| numRollback | Total number of transactions that have been rolled back. |
| host | The host address of the instance. |
| cacheHits | Number of times disk blocks were found already in the buffer cache. |
| idle_in_transaction | Number of idle_in_transaction process running in the server. |
| numSelect | Total number of live rows fetched by select queries. |
| maxConnections | The maximum number of concurrent connections to the database server. |
| tempFileSize | Total amount of data written to temporary files by queries. |
| idleProcesses | Number of idle process waiting in the server. |
| numCommit | Total number of transactions that have been committed. |
| cacheSize | The effective size of the disk cache that is available to a single query. |
| numConnections | Total number of backends currently connected to this server. |
| indexSize | Total size of the indices. |
| bufferSize | Amount of memory the database server uses for shared memory buffers. |
| dbSize | Total size of the databases. |
| upTime | Time difference between start time and current time. |
| abortedConnection | Number of aborted process in the server. |
| numInsert | Total number of rows inserted by queries in this database. |
| numDelete | Total number of rows deleted by queries in this database. |
| cacheHitRatio | Cache Hit Percentage on the server. |
| numDatabases | Number of Databases. |
| version | PostgreSQL version of the server. |
Database Details
| Metric | Description |
|---|---|
| blkReadTime | Time spent writing data file blocks by backends in this database, in milliseconds. |
| blocksRead | Number of disk blocks read in this database. |
| transPerSec | Number of transaction in this database per second. |
| numDeadTuple | Estimated number of dead rows in database. |
| numTransactions | Number of transactions in this database that have been committed and rolled back. |
| numLiveTuple | Estimated number of live rows in database. |
| numFetch | Number of live rows fetched by index scans in this database. |
| numRollback | Number of transactions in this database that have been rolled back. |
| numUpdate | Number of rows updated by queries in this database. |
| host | The host address of the instance. |
| numReturn | Number of live rows fetched by sequential scans and index entries returned by index scans in this database. |
| tempFileSize | Total amount of data written to temporary files by queries in this database. |
| _dbName | Name of the database. |
| numCommit | Number of transactions in this database that have been committed. |
| blocksHit | Number of times disk blocks were found already in the buffer cache, so that a read was not necessary (this only includes hits in the PostgreSQL buffer cache, not the operating system's file system cache). |
| blkWriteTime | Time spent writing data file blocks by backends in this database, in milliseconds. |
| numTempFile | Number of temporary files created by queries in this database. |
| indexSize | Total disk space used by all indexes in the database. |
| dbSize | Size of the database. |
| numInsert | Number of rows inserted by queries in this database. |
| numDelete | Number of rows deleted by queries in this database. |
| cacheHitRatio | Percentage of cacheHit of this database. |
| indexHitRatio | Percentage of indexHit of this table. |
| numTables | Number of tables in this database. |
Table Details
| Metric | Description |
|---|---|
| numDeadTuple | Estimated number of dead rows. |
| numLiveTuple | Estimated number of live rows. |
| numUpdate | Number of rows updated. |
| _tableName | Name of the table. |
| _dbName | Name of the database for this table. |
| tableSize | Total disk space used by the specified table. |
| idxBlksRead | Number of disk blocks read from all indexes on this table. |
| host | The host address of the instance. |
| seqScan | Number of sequential scans initiated on this table. |
| indexScanFetch | Number of live rows fetched by index scans. |
| heapBlksRead | Number of disk blocks read from this table. |
| idxBlksHit | Number of buffer hits in all indexes on this table. |
| heapBlksHit | Number of buffer hits in this table. |
| seqScanFetch | Number of live rows fetched by sequential scans. |
| indexSize | Total disk space used by indexes attached to the specified table. |
| numInsert | Number of rows inserted. |
| indexScan | Number of index scans initiated on this table. |
| numDelete | Number of rows deleted. |
| cacheHitRatio | Percentage of cacheHit of this table. |
| _schemaName | Name of the schema of this table. |
| indexHitRatio | Percentage of indexHit of this table. |
Index Details
| Metric | Description |
|---|---|
| _indexName | Name of this index. |
| blksHit | Number of buffer hits in this index. |
| _tableName | Name of the table for this index. |
| blksRead | Number of disk blocks read from this index. |
| numFetch | Number of live table rows fetched by simple index scans using this index. |
| indexScan | Number of index scans initiated on this index. |
| _schemaName | Name of the schema of this index. |
| _dbName | Name of the database for this index. |
| host | The host address of the instance. |
| numReturn | Number of index entries returned by scans on this index. |
Query Details
| Metric | Description |
|---|---|
| runtime | Period of time for the current query is running. |
| userName | Name of the user logged into this backend. |
| wait_event | True if backend is currently waiting, otherwise False. |
| _dbName | Name of the database this backend is connected to. |
| host | The host address of the instance. |
| state | Current overall state of this backend. Possible values are:active, idle, idle in transaction, idle in transaction (aborted), fastpath function call, disabled. |
| _queryName | If state is active this field shows the currently executing query. In all other states, it shows the last query that was executed. |
Master Replication Details
| Metric | Description |
|---|---|
| writeLag | Time elapsed between flushing recent WAL locally and receiving notification that this standby server has written it. |
| replayLSN | Last write-ahead log location replayed into the database on this standby server. |
| sentLSN | Last write-ahead log location sent on this connection. |
| pid | Process ID of a WAL sender process. |
| clientAddress | IP address of the client connected to this WAL sender. If this field is null, it indicates that the client is connected via a Unix socket on the server machine. |
| replayLag | Time elapsed between flushing recent WAL locally and receiving notification that this standby server has written, flushed and applied it. |
| syncPriority | Priority of this standby server for being chosen as the synchronous standby in a priority-based synchronous replication. This has no effect in a quorum-based synchronous replication. |
| writeLSN | Last write-ahead log location written to disk by this standby server. |
| host | The host address of the instance. |
| state | Current WAL sender state. Possible values are startup, catchup, streaming, backup, stopping. |
| applicationName | Name of the application that is connected to this WAL sender. |
| flushLSN | Last write-ahead log location flushed to disk by this standby server. |
| syncState | Synchronous state of this standby server. |
| flushLag | Time elapsed between flushing recent WAL locally and receiving notification that this standby server has written and flushed it. |
| userName | Name of the user logged into this WAL sender process. |
| backendStart | Time when this process was started, i.e., when the client connected to this WAL sender. |
Replication Slot Details
| Metric | Description |
|---|---|
| temporary | True if this is a temporary replication slot. Temporary slots are not saved to disk and are automatically dropped on error or when the session has finished. |
| slotType | The slot type: physical or logical. |
| active | True if this slot is currently actively being used. |
| active_pid | The process ID of the session using this slot if the slot is currently actively being used. NULL if inactive. |
| slotPlugin | The base name of the shared object containing the output plugin this logical slot is using, or null for physical slots. |
| slotName | A unique, cluster-wide identifier for the replication slot. |
| database | The name of the database this slot is associated with, or null. Only logical slots have an associated database. |
| confirmed_flush_lsn | The address (LSN) up to which the logical slot's consumer has confirmed receiving data. Data older than this is not available anymore. NULL for physical slots. |
| host | The host address of the instance. |
| restart_lsn | The address (LSN) of oldest WAL which still might be required by the consumer of this slot and thus won't be automatically removed during checkpoints unless this LSN gets behind more than max_slot_wal_keep_size from the current LSN. NULL if the LSN of this slot has never been reserved. |
Slave Replication Details
| Metric | Description |
|---|---|
| receivedLSN | Last write-ahead log location already received and written to disk, but not flushed. |
| latestEndLSN | Last write-ahead log location reported to origin WAL sender. |
| conninfo | Connection string used by this WAL receiver, with security-sensitive fields obfuscated. |
| receiveStartTLI | First timeline number used when WAL receiver is started. |
| pid | Process ID of the WAL receiver process. |
| senderHost | Host of the PostgreSQL instance this WAL receiver is connected to. This can be a host name, an IP address, or a directory path if the connection is via Unix socket. |
| slotName | Replication slot name used by this WAL receiver. |
| host | The host address of the instance. |
| lastMsgSendTime | Send time of last message received from origin WAL sender. |
| lastMsgReceiptTime | Receipt time of last message received from origin WAL sender. |
| latestEndTime | Time of last write-ahead log location reported to origin WAL sender. |
| senderPort | Port number of the PostgreSQL instance this WAL receiver is connected to. |
| receivedTLI | Timeline number of last write-ahead log location received and flushed to disk, the initial value of this field being the timeline number of the first log location used when WAL receiver is started. |
| receiveStartLSN | First write-ahead log location used when WAL receiver is started. |
| status | Activity status of the WAL receiver process. |