Monitor Dynamo Database
Overview
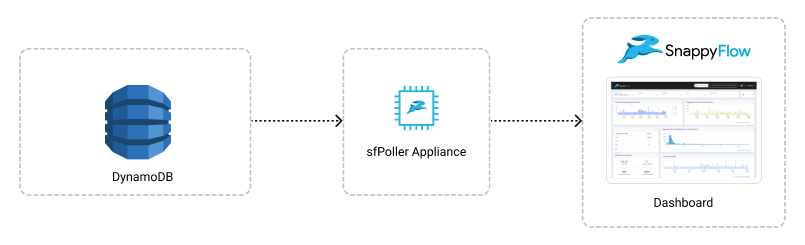
Amazon Dynamo DB is a cloud-native non SQL database service that provides fast and predictable performance with seamless scalability. To monitor Dynamo DB, metrics and logs of Dynamo DB are gathered by sfPoller and displayed within SnappyFlow dashboard.
Prerequisites
- To collect metrics and logs of Dynamo DB, it is necessary to have an IAM Role with CloudWatch access and sfPoller set up within your AWS environment. Click here to learn more about setting up sfPoller in your AWS environment.
- To monitor stream logs, you have to enable data stream for Dynamo DB tables and send the data stream event to CloudWatch log group through services such as Lambda, EventBridge, etc.
Create a Policy to collect DynamoDB data from CloudWatch
Sign in to the AWS Management Console and open the IAM console at https://console.aws.amazon.com/iam/.
Follow the below steps to create a policy in the IAM console.
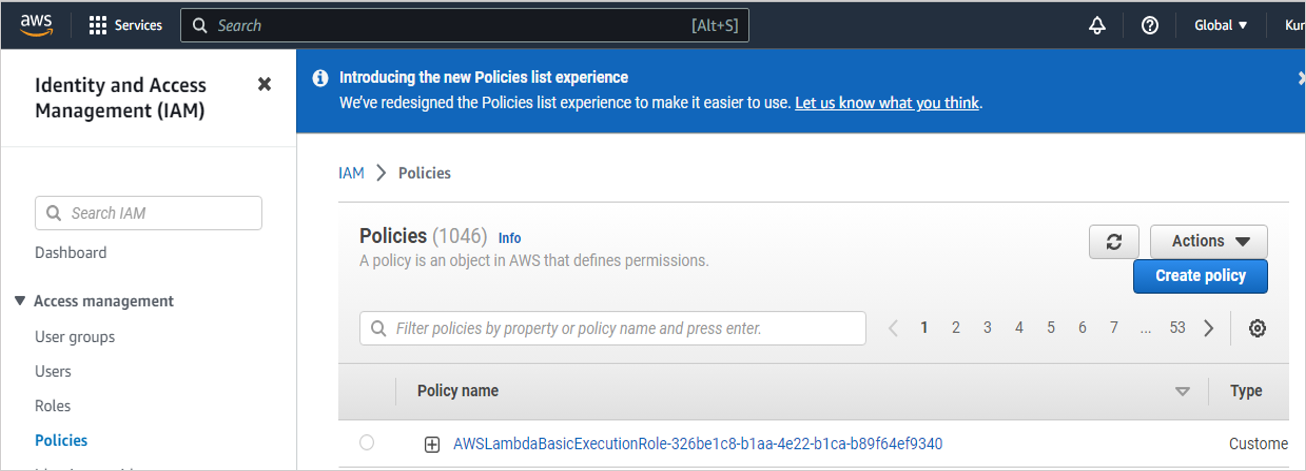
Navigate to Access Management > Policies
In the Policies window, click the
Create policybuttonIn the Create policy window, go to the JSON tab
Copy and paste the below-mentioned JSON code into the policy editor
{
  "Version": "2012-10-17",
  "Statement": [
      {
        "Sid": "VisualEditor0",
        "Effect": "Allow",
        "Action": [
                   "dynamodb:ListTables",
                   "dynamodb:DescribeTable",
                   "dynamodb:ListTagsOfResource",
                   ],
        },
    ],
}
Click the
Next: Tags>Next: ReviewbuttonIn the Review policy window, give Name:
CloudWatchReadOnlyAccessand Description (Optional) for the policy and review the list of permissions.Click the
Create policybutton
Attach the
CloudWatchReadOnlyAccesspolicy to a dedicated IAM Role for read-only access.
Configure sfPoller to Collect Metrics and Logs
Follow the below step to add endpoints and plugins:
In the Application tab of sfPoller, navigate to your Project > Application.
Click on the Application, it will take you to the
Endpointpage.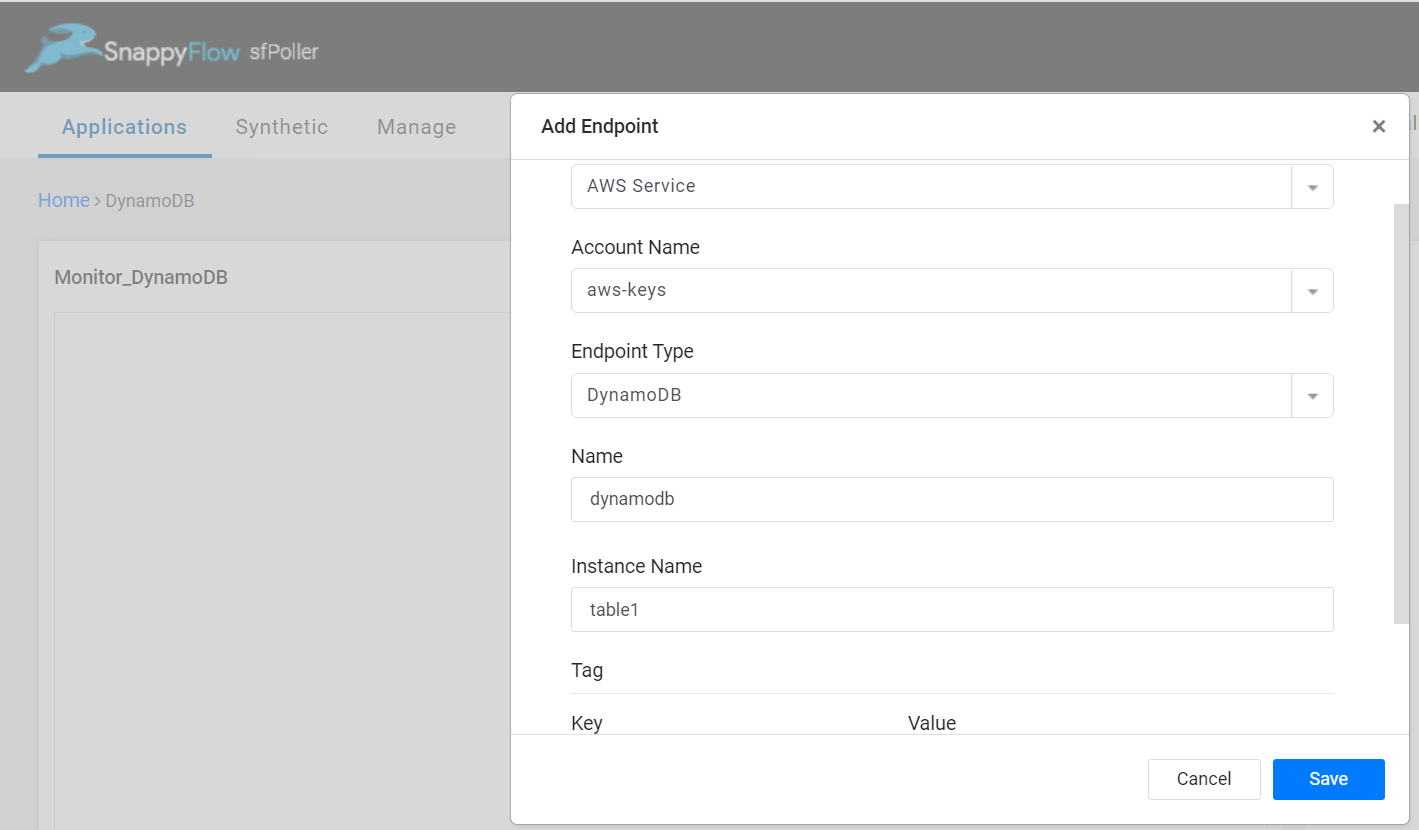
Click the
Add Endpointbutton, add the following data, and save.- Service Type: Select
AWS Service - Account Name: Select an account name. Example: aws-keys
- Endpoint Type: Select
DynamoDB - Name: Give an unique name to the endpoint
- Instance Name: Name of the table that need be monitored
- Service Type: Select
In the Plugins window, click the
+Addbutton.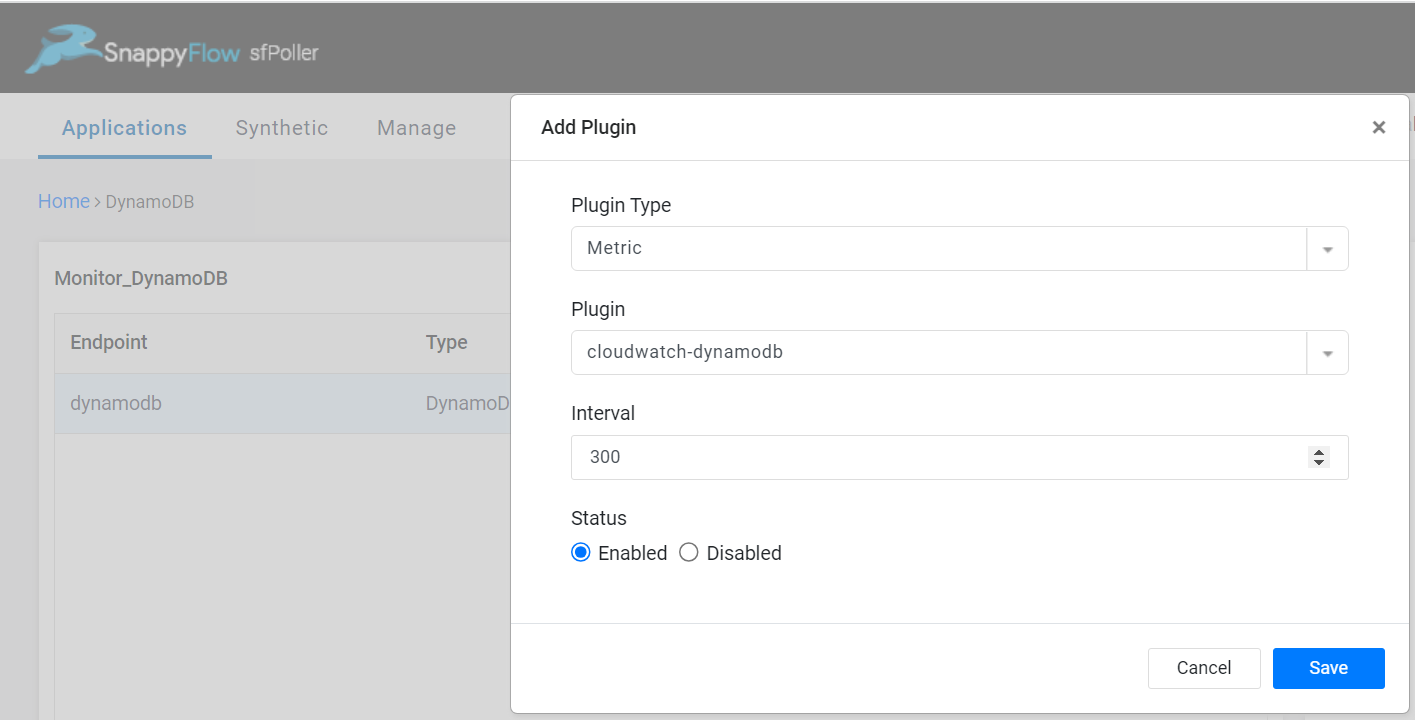
In the Add Plugin window, add the below details to collect metrics of Dynamo DB.
- Plugin Type: Select
Metric - Plugin: Select
cloudwatch-dynamodb - Interval: Choose an interval value. The minimum value for the interval is 300
- Status: By default, the status is
Enabled
- Plugin Type: Select
Select the
Savebutton.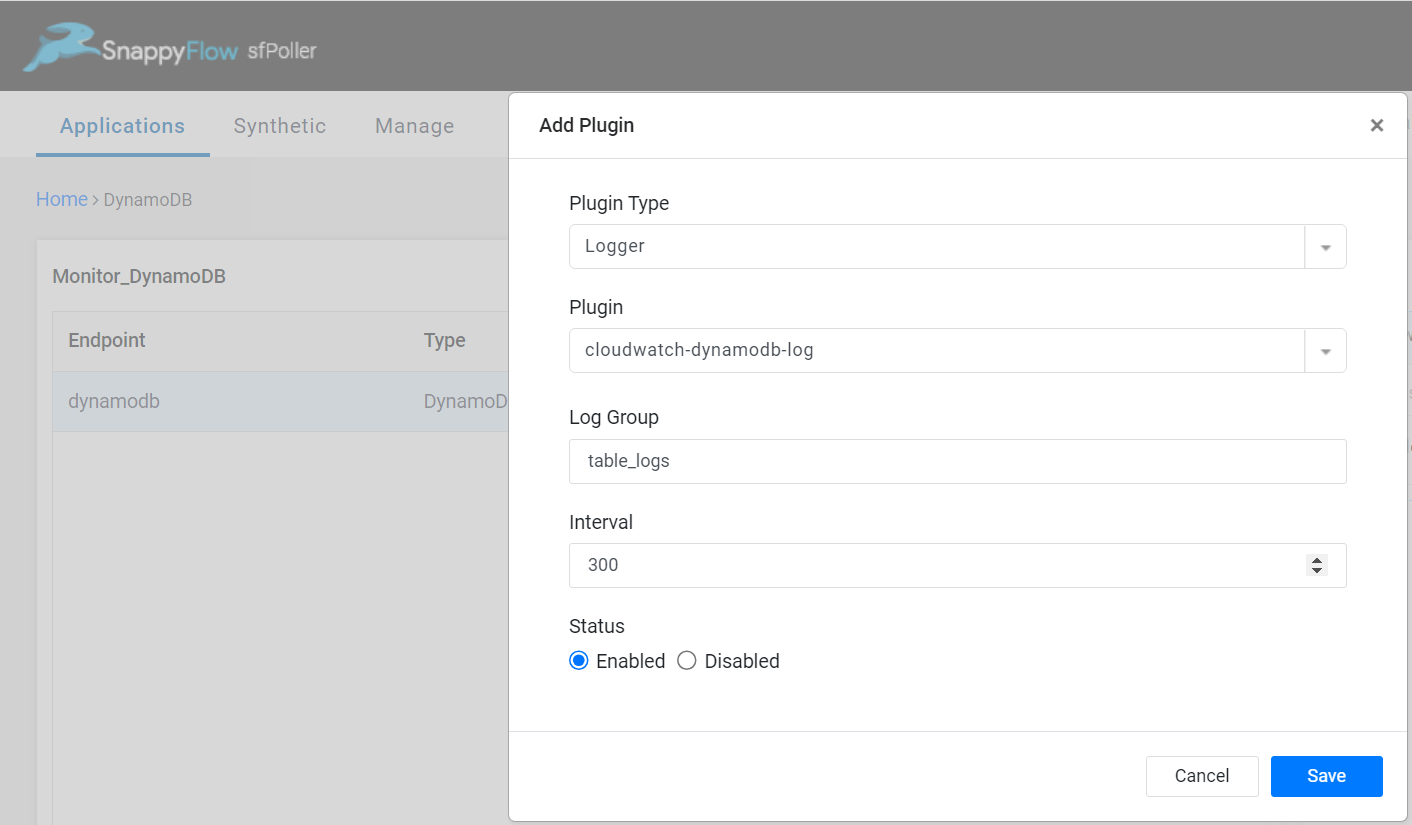
Again select the
+Addbutton and in the Add Plugin window, add below details to collect logs of Dynamo DB.- Plugin Type: Select
Logger - Plugin: Select
cloudwatch-dynamodb-log - Log Group: Give the name of cloudwatch log group to which the stream events are being sent
- Interval: Choose an interval value. The minimum value for the interval is 300
- Status: By default, the status is
Enabled
- Plugin Type: Select
Select the
Savebutton.Click the global
Savebutton in the window's top right corner to save all the changes made so far.
View Database Metrics and Logs
Follow the below steps to view the metrics collected from Dynamo DB.
Go to the Application tab in SnappyFlow and navigate to your Project > Application > Dashboard.
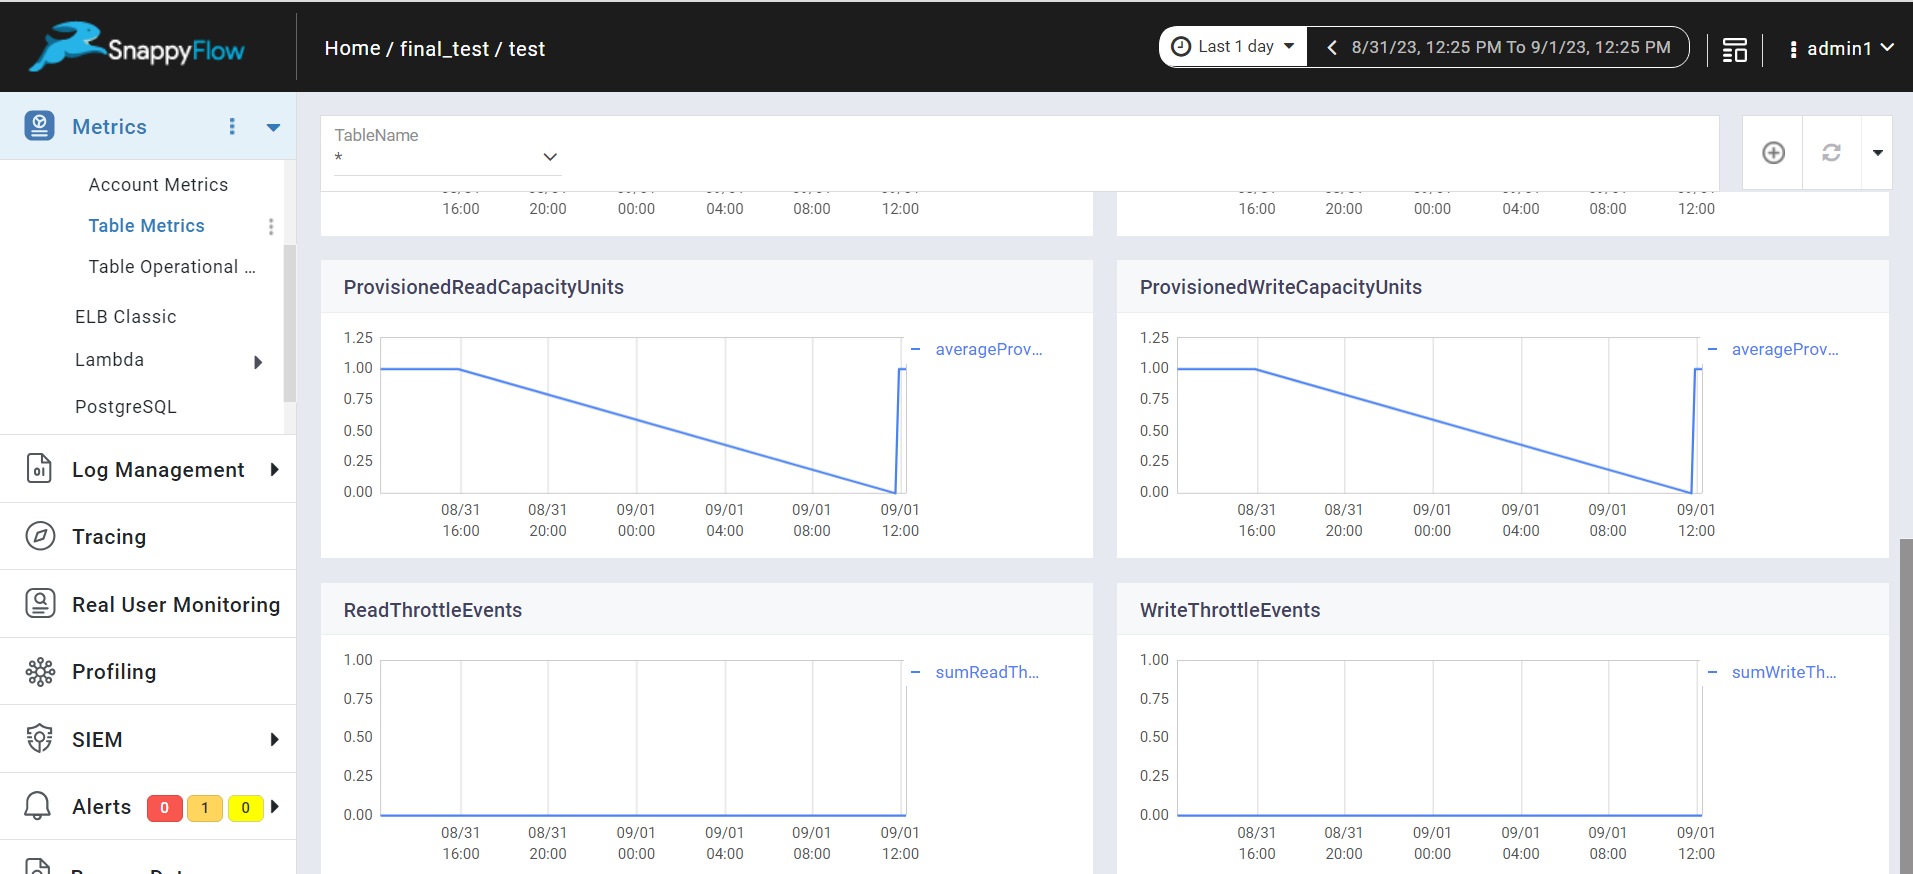
You can view the database metrics in the Metrics section.
Once plugins are added to sfPoller, they will be automatically detected within the Metrics section. However, if the plugins are not detected, you can import templates to view the corresponding metrics.
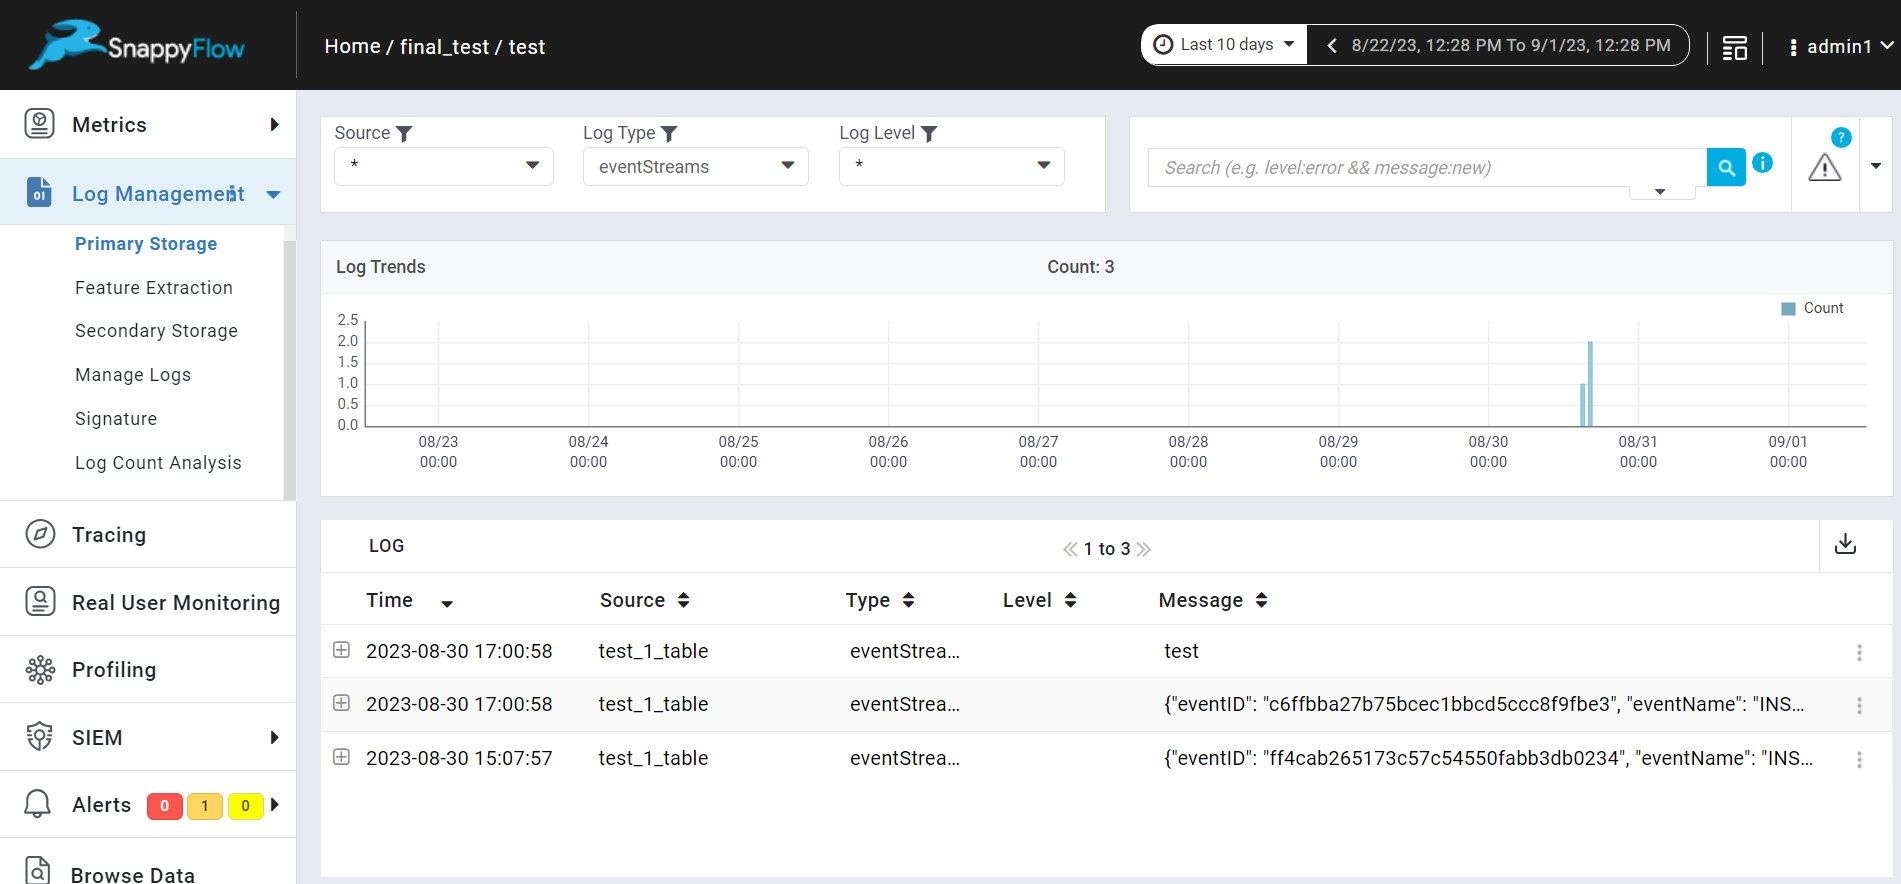
You can view the database logs in the Log Management section.
To access the unprocessed data gathered from the plugins, navigate to the Browse data section and choose the
Index: Metric,Instance: Endpoint,Plugin,andDocument Type.
Template Details
| Template | Plugin | Document Type | Description |
|---|---|---|---|
| DynamoDB | cloudwatch-dynamodb | tableMetrics, tableOperationMetrics, AccountMetrics, tableDescription | Collects metrics from Dynamo DB |
| - | cloudwatch-dynamodb-log | eventStreams | Collects logs from Dynamo DB |
Metric List
Table Metrics
| Metric | Description |
|---|---|
| ConditionalCheckFailedRequests | The number of failed attempts to perform conditional writes. |
| ConsumedReadCapacityUnits | The number of read capacity units consumed over the specified time period, so you can track how much of your provisioned throughput is used. |
| ConsumedWriteCapacityUnits | The number of write capacity units consumed over the specified time period, so you can track how much of your provisioned throughput is used. |
| ProvisionedReadCapacityUnits | The number of provisioned read capacity units for a table. |
| ProvisionedWriteCapacityUnits | The number of provisioned write capacity units for a table. |
| ReadThrottleEvents | Requests to Dynamo DB that exceed the provisioned read capacity units for a table. |
| WriteThrottleEvents | Requests to Dynamo DB that exceed the provisioned write capacity units for a table. |
Table Operation Metrics
| Metric | Description |
|---|---|
| ThrottledRequests | Requests to Dynamo DB that exceed the provisioned throughput limits on a resource. |
| SystemErrors | The requests to Dynamo DB or Amazon Dynamo DB Streams that generate an HTTP 500 status code during the specified time period. |
| SuccessfulRequestLatency | The latency of successful requests to Dynamo DB or Amazon Dynamo DB Streams during the specified time period. |
Account Metrics
| Metric | description |
|---|---|
| MaxProvisionedTableWriteCapacityUtilization | The percentage of provisioned write capacity utilized by the highest provisioned write table. |
| MaxProvisionedTableReadCapacityUtilization | The percentage of provisioned read capacity utilized by the highest provisioned read table. |
| UserErrors | Requests to Dynamo DB streams that generate an HTTP 400 status code during the specified time period. |