Monitor Clickhouse DB on Instance
Overview
Clickhouse database (DB) on instances is monitored using sfAgent configured with Clickhouse plugin.
The Clickhouse plugin has been tested on followings versions and OS.
Clickhouse version - 23.3.8.21
OS - Ubuntu 20.04.1
Get Started
To get started with Clickhouse integration, create a user and grant permissions to collect data from your Clickhouse DB.
Create a read-only user with the following code in the user section of
/etc/clickhouse-server/users.xmlfile.<!—create user in <users> -->
<new-user-name>
<!—enter password-->
<password>password</password>
<!--set profile to readonly -->
<profile>readonly</profile>
</ new-user-name>
- Save and restart the server.
Configuration
Add the below-mentioned configuration to the config.yaml which is located at the following path /opt/sfagent/ directory .
metrics:
  plugins:
    - name: clickhouse
      enabled: true
      interval: 60
      config:
        documentsTypes:
          - hostDetails
          - clusterDetails
          - tableStats
          - osDetails
          - exceptionDetails
          - slowQueryDetails
        password: password
        port: 9000
        user: username
View Database Metrics
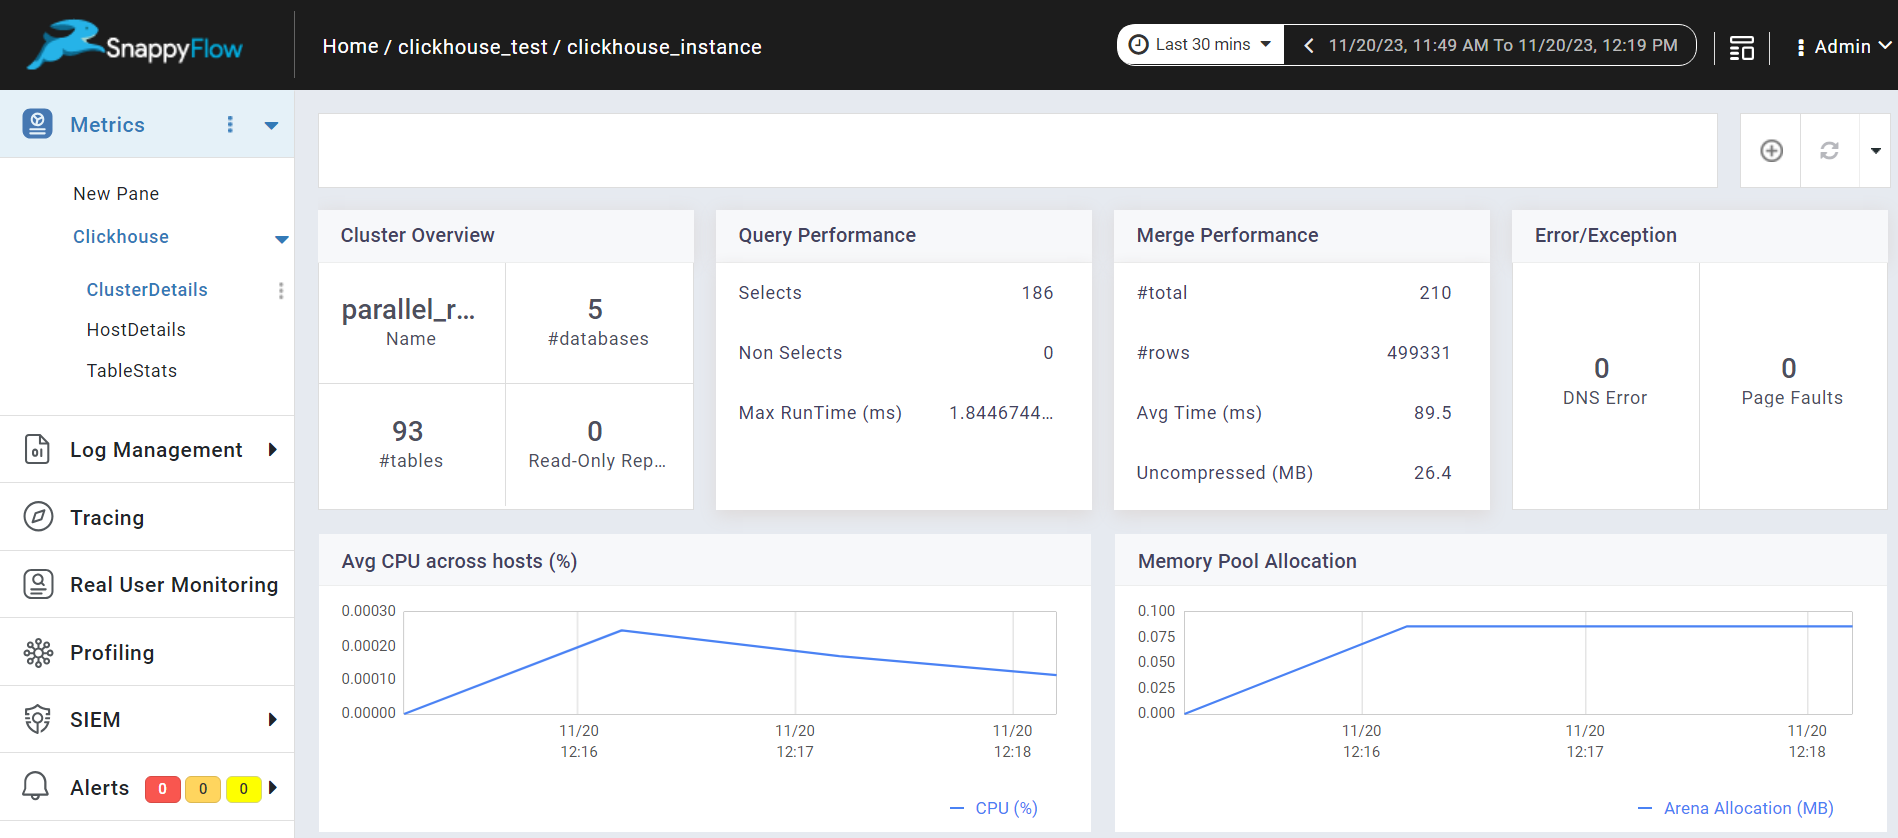
Go to the Application tab in SnappyFlow and navigate to your Project > Application > Dashboard.
In the dashboard window, Clickhouse DB metrics are displayed in the Metric section.
noteOnce the Clickhouse configuration settings are done, the Clickhouse plugin will be automatically detected within the Metrics section.
To access the unprocessed data gathered from the plugins, navigate to the Browse data section and choose the
Index: Metric,Instance: Endpoint,Plugin, andDocument Type.
Metric List
Host Details
| Name | Description |
|---|---|
| ContextLock | Number of times the lock of Context was acquired or tried to acquire. This is global lock |
| CompressedReadBufferBlocks | Number of compressed blocks from compressed sources (files, network) |
| CompressedReadBufferBytes | Number of uncompressed bytes read from compressed sources (files, network) |
| DiskReadElapsedMicroseconds | Total time spent waiting for read syscall. This include reads from page cache |
| DiskWriteElapsedMicroseconds | Total time spent waiting for write syscall. This include writes to page cache |
| DistributedConnectionFailAtAll | Total number of distributed connection failures that have occurred on the ClickHouse DB server |
| MergeTreeDataWriterCompressedBytes | Bytes written to filesystem for data INSERTed to MergeTree tables |
| QueryThread | Number of query processing threads |
| Uptime | Time from server starting (in seconds) |
| FileOpen | Number of files opened |
| ZooKeeperUserExceptions | Number of ZooKeeper user exceptions |
| ZooKeeperRequest | Number of requests to ZooKeeper in fly |
| BackgroundDistributedSchedulePoolTask | Number of active tasks in BackgroundDistributedSchedulePool. This pool is used for distributed sends that is done in background |
| BackgroundMovePoolTask | Number of active tasks in BackgroundProcessingPool for moves |
| BackgroundSchedulePoolTask | Number of active tasks in BackgroundSchedulePool. This pool is used for periodic ReplicatedMergeTree tasks, like cleaning old data parts, altering data parts, replica re-initialization, etc. |
| GlobalThreadActive | Number of threads in global thread pool running a task |
| GlobalThread | Number of threads in global thread pool |
| LocalThreadActive | Number of threads in local thread pools running a task |
| LocalThread | Number of threads in local thread pools. The threads in local thread pools are taken from the global thread pool |
| HttpConnection | Number of connections to HTTP server |
| MaxPartCountForPartition | Maximum number of parts per partition across all partitions of all tables of MergeTree family. Values larger than 300 indicates misconfiguration, overload, or massive data loading. |
| ZooKeeperWaitMicroseconds | Total time spent waiting for ZooKeeper in microseconds |
| PartMutation | Number of mutations (ALTER DELETE/UPDATE) |
| ReplicasMaxInsertsInQueue | Maximum number of INSERT operations in the queue (still to be replicated) across Replicated tables |
| ReplicasMaxMergesInQueue | Maximum number of merge operations in the queue (still to be applied) across Replicated tables |
| ReplicasSumInsertsInQueue | Sum of INSERT operations in the queue (still to be replicated) across Replicated tables. |
| ReplicasSumMergesInQueue | Sum of merge operations in the queue (still to be applied) across Replicated tables. |
| JemallocBackgroundThreadNumRuns | An internal metric of the low-level memory allocator (jemalloc) |
Cluster Details
| Name | Description |
|---|---|
| NumberOfDatabases | Number of Databases available in server |
| NumberOfTables | Total number of tables in database |
| ClusterName | Cluster name |
| ReadonlyReplica | Number of Replicated tables that are currently in readonly state due to re-initialization after ZooKeeper session loss or due to startup without ZooKeeper configured |
| ArenaAllocBytes | Number of bytes allocated for memory Arena (used for GROUP BY and similar operations) |
| HardPageFaults | The number of hard page faults in query execution threads. High values indicate either that you forgot to turn off swap on your server, or eviction of memory pages of the ClickHouse binary during very high memory pressure, or successful usage of the 'mmap' read method for the tables data |
| UserTimeMicroseconds | Total time spent in processing (queries and other tasks) threads executing CPU instructions in user space. This include time CPU pipeline was stalled due to cache misses, branch mispredictions, hyper-threading, etc. |
| ZooKeeperTransactions | Total transactions in ZooKeeperRequest, ZooKeeperWatch, ZooKeeperSession. ZooKeeperRequest - Number of sessions (connections) to ZooKeeper. ZooKeeperWatch - Number of watches (event subscriptions) in ZooKeeper. ZooKeeperSession - Number of requests to ZooKeeper in fly. |
| DelayedInserts | Number of INSERT queries that are throttled due to high number of active data parts for partition in a MergeTree table. |
| RealTimeMicroseconds | Total time spent in processing (queries and other tasks) threads. |
| LongestRunningQuery | Longest running query (in ms) |
| Query | Number of queries to be interpreted and potentially executed. May include internal queries initiated by ClickHouse itself. Does not count subqueries |
| SelectQuery | Same as Query, but only for SELECT queries. |
| MergedUncompressedBytes | Uncompressed bytes (for columns as they stored in memory) that was read for background merges. This is the number before merge. |
| Merge | Number of launched background merges. |
| MergedRows | Rows read for background merges. This is the number of rows before merge. |
| MergesTimeMilliseconds | Total time spent for background merges |
| DnsError | Number of DNS errors |
| InsertQuery | Number of insert Query Performed. |
| FailedQuery | Number of failed queries. |
| FailedSelectQuery | Number of failed select queries. |
| InsertedRows | Number of rows INSERTed to all tables. |
| InsertedBytes | Number of bytes (uncompressed; for columns as they stored in memory) INSERTed to all tables. |
| MergeTreeDataWriterRows | Number of rows INSERTed to MergeTree tables. |
| ContextLockWait | Number of threads waiting for lock in Context. This is global lock. |
Table Stats
| Name | Description |
|---|---|
| TablePartsRows | Number of rows in all table parts |
| TablePartitions | Number of table partitions |
| TablePartsBytes | Size of all table parts in bytes |
| TableParts | Number of table parts |
OS Details
| Name | Description |
|---|---|
| OsCpuWaitMicroseconds | Total time a thread was ready for execution but waiting to be scheduled by OS, from the OS point of view. |
| OsIoWaitMicroseconds | Total time spent waiting for I/O in microseconds. |
| OsWriteBytes | Number of bytes written to disks or block devices. |
Exception Details
| Name | Description |
|---|---|
| ExceptionQuery | The query that caused the exception. |
| ExceptionQueryDuration | The duration of the query that caused the exception. |
Slow Query Details
| Name | Description |
|---|---|
| SlowQuery | The query that took more than 1000 ms to execute. |
| SlowqueryDuration | The duration of the slow query. |