Monitor Postgres DB on Instance
Overview
PostgreSQL on instances is monitored using sfAgent configured with Postgres plugin.
Get Started
To get started with PostgreSQL integration, create a user and grant permissions to collect data from your PostgreSQL server.
Create New User
Create a read-only user with the following command:
create user <username> with password '<password>';
Use the username and password created in this section while setting access permission and configuration.
Set Access Permission
For version 10.0 or greater, use the below code to set access permission.
grant SELECT ON pg_stat_database to <username>;
grant pg_monitor to <username>;
For older versions, use the below code to set access permission.
grant SELECT ON pg_stat_database to <username>;
By default, these permissions are granted to the root user
Prerequisite to Collect Total Query Duration
Execute the following command to check
pg_stat_statementis available.SELECT * FROM pg_available_extensions WHERE name = 'pg_stat_statements' and installed_version is not null;If the table is empty, using the following command create the extension.
CREATE EXTENSION pg_stat_statements;
alter system set shared_preload_libraries='pg_stat_statements';
Once the extension is added restart the Postgres service using the following command: systemctl restart postgresql.
Configuration
Refer to sfAgent section for steps to install and automatically generate plugin configurations. User can also manually add the configuration shown below to config.yaml under /opt/sfagent/ directory.
key: <profile_key>
tags:
  Name: <name>
  appName: <app_name>
  projectName: <project_name>
metrics:
  plugins:
    - name: postgres
      enabled: true
      interval: 60
      config:
        documentsTypes:
          - databaseDetails
          - indexDetails
          - queryDetails
          - serverDetails
          - tableDetails
        host: 127.0.0.1
        password: <password>
        port: 5432
        user: <username>
logging:
  plugins:
    - name: postgres-general
      enabled: true
      config:
        log_level:
          - error
          - warning
          - info
          - log
        log_path: /var/log/postgresql/postgresql-10-main.log
    - name: postgres-slowquery
      enabled: true
      config:
        log_path: /var/log/postgresql/postgresql-10-main.log
Enable Logs
Enable PostgreSQL general logs
It is required to configure PostgreSQL.conf file to enable PostgreSQL logs. To locate the PostgreSQL.conf, execute the following command:
postgres=# show config_file;
           config_file
----------------------------------
 /data/pgsql/data/postgresql.conf
(1 row)
Update the Postgresql.conf file with the variables shown below:
log_min_messages = warning  # set level as appropriate
log_line_prefix = '< %m > '
Example:
once the logs are enabled, PostgreSQL general logs will be generated in the below format.
< 2023-05-04 11:52:10.470 IST > LOG: duration: 1006.577 ms statement: select pg_sleep(1);
Enable PostgreSQL Slow Query logs
To enable PostgreSQL slow query logs, update the PostgreSQL.conf file with the variables shown below:
log_min_duration_statement = 200
Enable Total Query Duration
To enable PostgreSQL total query duration, update the PostgreSQL.conf file with the variables shown below:
pg_stat_statements.track = all
track_activities = on
track_io_timing = on
track_functions = all
View Database Metrics and Logs
- Go to the Application tab in SnappyFlow and navigate to your Project > Application > Dashboard.
- In the dashboard window, click the tab menu
...icon on the Metric section. - Select the Import from template option.
- In the Import to Metrics Panes window, select Filter By:
Standard, Template Name:PostgreSQL. - Click the
Savebutton. - Database metrics are displayed in the Metrics section of the dashboard.
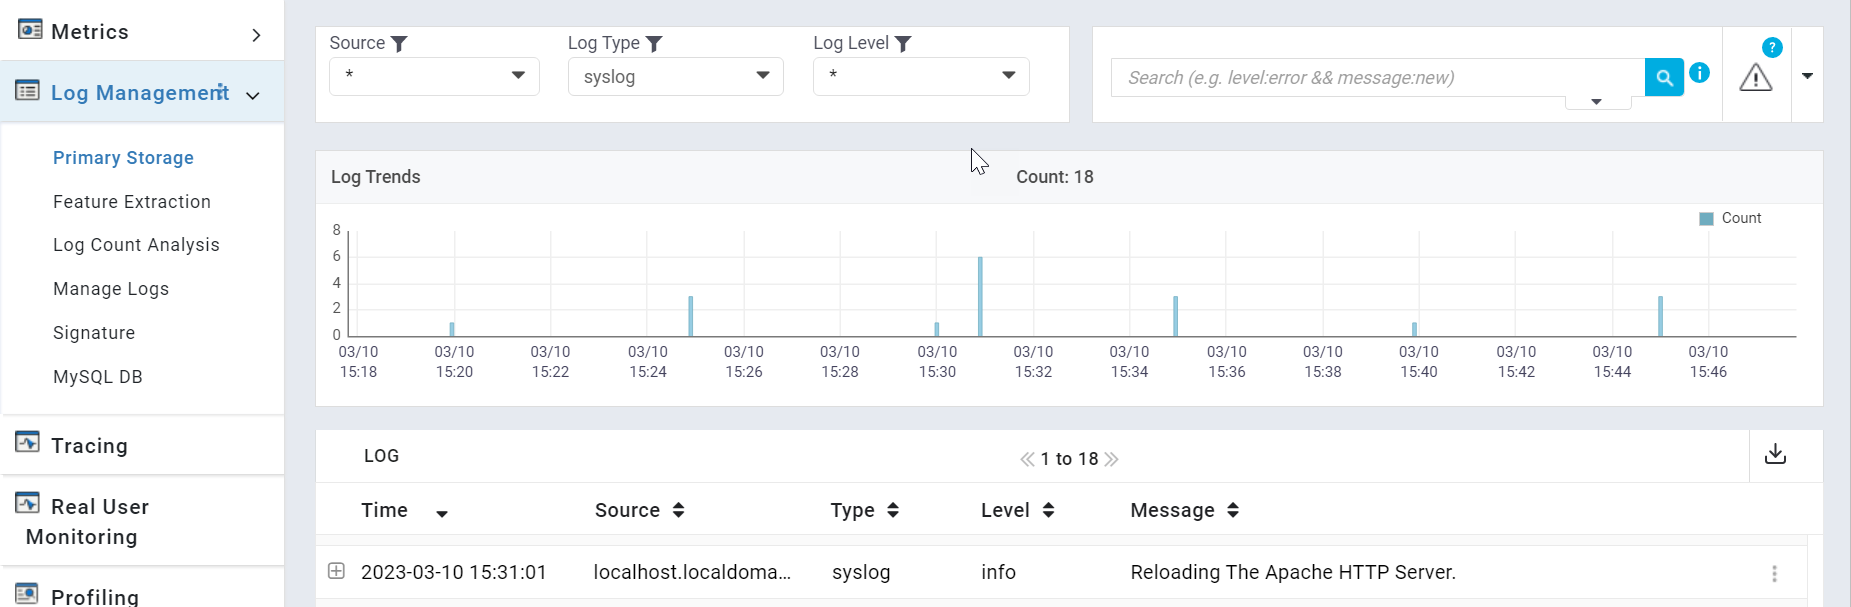
To view general logs, navigate to Log management > Primary storage.
In the Primary Storage window, set the log filter to a general log as per the requirement.
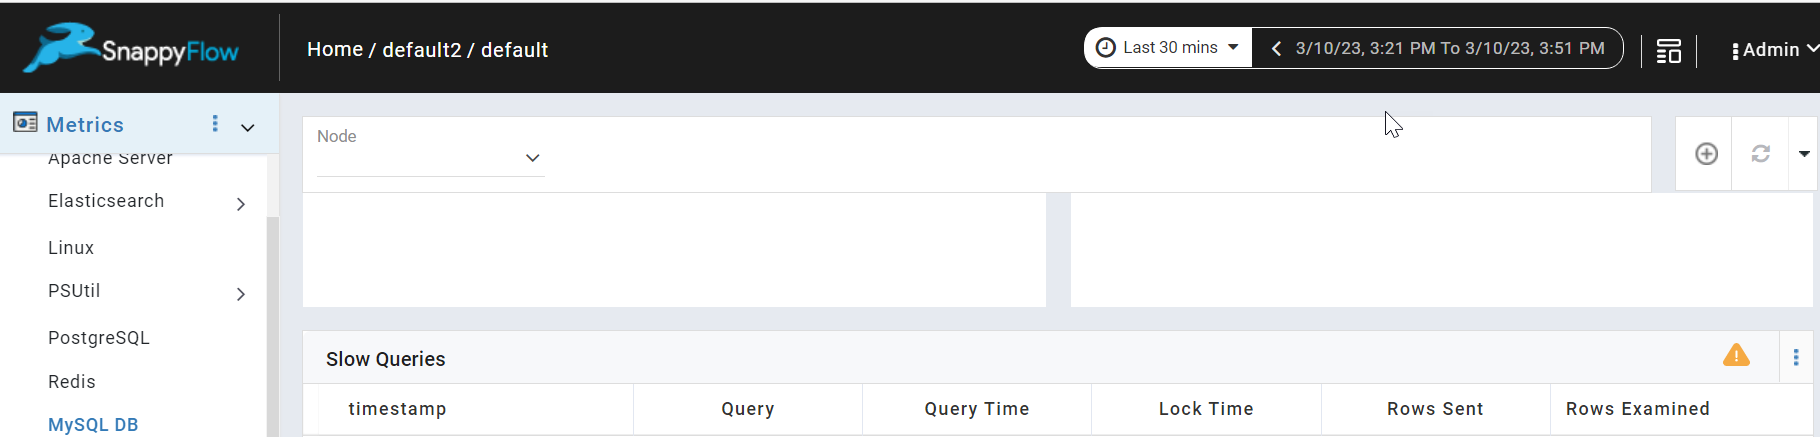
To view slow query logs, navigate to Metrics > Slow Queries.
To access the unprocessed data gathered from the plugins, navigate to the Browse data section and select the following data:
- Index:
Metrics - Instance: Select an
instance - Plugin:
postgres - Document type:
serverDetails,databaseDetails,tableDetails,slowqueryDetails,postgres-general,postgres-slowquery,Session Details,checkpointDetails,lockDetails,vaccumDetails
Metric List
Server Details
| Metric | Description |
|---|---|
| numCreatedTempFiles | Total number of temporary files created. |
| numTransactions | Total number of transactions that have been committed and rolled back. |
| archiveFailCount | Number of failed attempts for archiving WAL files. |
| activeProcesses | Number of active process running in the server. |
| archivedCount | Number of WAL files that have been successfully archived. |
| numUpdate | Total number of rows updated by queries. |
| numRollback | Total number of transactions that have been rolled back. |
| host | The host address of the instance. |
| cacheHits | Number of times disk blocks were found already in the buffer cache. |
| idle_in_transaction | Number of idle_in_transaction process running in the server. |
| numSelect | Total number of live rows fetched by select queries. |
| maxConnections | The maximum number of concurrent connections to the database server. |
| tempFileSize | Total amount of data written to temporary files by queries. |
| idleProcesses | Number of idle process waiting in the server. |
| numCommit | Total number of transactions that have been committed. |
| cacheSize | The effective size of the disk cache that is available to a single query. |
| numConnections | Total number of backends currently connected to this server. |
| indexSize | Total size of the indices. |
| bufferSize | Amount of memory the database server uses for shared memory buffers. |
| dbSize | Total size of the databases. |
| upTime | Time difference between start time and current time. |
| abortedConnection | Number of aborted process in the server. |
| numInsert | Total number of rows inserted by queries in this database. |
| numDelete | Total number of rows deleted by queries in this database. |
| cacheHitRatio | Cache Hit Percentage on the server. |
| numDatabases | Number of Databases. |
| version | PostgreSQL version of the server. |
| activeSession | Total number of active sessions. |
| blockedSession | Total number of blocked sessions. |
Database Details
| Metric | Description |
|---|---|
| blkReadTime | Time spent writing data file blocks by backends in this database, in milliseconds. |
| blocksRead | Number of disk blocks read in this database. |
| transPerSec | Number of transaction in this database per second. |
| numDeadTuple | Estimated number of dead rows in database. |
| numTransactions | Number of transactions in this database that have been committed and rolled back. |
| numLiveTuple | Estimated number of live rows in database. |
| numFetch | Number of live rows fetched by index scans in this database. |
| numRollback | Number of transactions in this database that have been rolled back. |
| numUpdate | Number of rows updated by queries in this database. |
| host | The host address of the instance. |
| numReturn | Number of live rows fetched by sequential scans and index entries returned by index scans in this database. |
| tempFileSize | Total amount of data written to temporary files by queries in this database. |
| _dbName | Name of the database. |
| numCommit | Number of transactions in this database that have been committed. |
| blocksHit | Number of times disk blocks were found already in the buffer cache, so that a read was not necessary (this only includes hits in the PostgreSQL buffer cache, not the operating system's file system cache). |
| blkWriteTime | Time spent writing data file blocks by backends in this database, in milliseconds. |
| numTempFile | Number of temporary files created by queries in this database. |
| indexSize | Total disk space used by all indexes in the database. |
| dbSize | Size of the database. |
| numInsert | Number of rows inserted by queries in this database. |
| numDelete | Number of rows deleted by queries in this database. |
| cacheHitRatio | Percentage of cacheHit of this database. |
| indexHitRatio | Percentage of indexHit of this table. |
| numTables | Number of tables in this database. |
Table Details
| Metric | Description |
|---|---|
| numDeadTuple | Estimated number of dead rows. |
| numLiveTuple | Estimated number of live rows. |
| numUpdate | Number of rows updated. |
| _tableName | Name of the table. |
| _dbName | Name of the database for this table. |
| tableSize | Total disk space used by the specified table. |
| idxBlksRead | Number of disk blocks read from all indexes on this table. |
| host | The host address of the instance. |
| seqScan | Number of sequential scans initiated on this table. |
| indexScanFetch | Number of live rows fetched by index scans. |
| heapBlksRead | Number of disk blocks read from this table. |
| idxBlksHit | Number of buffer hits in all indexes on this table. |
| heapBlksHit | Number of buffer hits in this table. |
| seqScanFetch | Number of live rows fetched by sequential scans. |
| indexSize | Total disk space used by indexes attached to the specified table. |
| numInsert | Number of rows inserted. |
| indexScan | Number of index scans initiated on this table. |
| numDelete | Number of rows deleted. |
| cacheHitRatio | Percentage of cacheHit of this table. |
| _schemaName | Name of the schema of this table. |
| indexHitRatio | Percentage of indexHit of this table. |
Index Details
| Metric | Description |
|---|---|
| _indexName | Name of this index. |
| blksHit | Number of buffer hits in this index. |
| _tableName | Name of the table for this index. |
| blksRead | Number of disk blocks read from this index. |
| numFetch | Number of live table rows fetched by simple index scans using this index. |
| indexScan | Number of index scans initiated on this index. |
| _schemaName | Name of the schema of this index. |
| _dbName | Name of the database for this index. |
| host | The host address of the instance. |
| numReturn | Number of index entries returned by scans on this index. |
Slow Query Details
| Metric | Description |
|---|---|
| runtime | Period of time for the current query is running. |
| userName | Name of the user logged into this backend. |
| wait_event | True if backend is currently waiting, otherwise False. |
| _dbName | Name of the database this backend is connected to. |
| host | The host address of the instance. |
| state | Current overall state of this backend. Possible values are: active, idle, idle in transaction, idle in transaction (aborted), fastpath function call, disabled. |
| _queryName | If state is active this field shows the currently executing query. In all other states, it shows the last query that was executed. |
Session Details
| Metric | Description |
|---|---|
| blockedSession | Total number of blocked sessions. |
| totalqueryDuration | The total duration of active sessions in PostgreSQL database. |
| averageDuration | The average duration of active sessions in PostgreSQL database. |
| sessionperuser | Count or frequency of sessions associated with each user. |
| sessionperDatabase | The host address of the instance. |
| sessionperHost | Count of sessions associated with each host. |
| sessionperApplication | Count of sessions associated with each application. |
| connectionperDatabase | Count of sessions associated with each database. |
| PID | PID assigned to the session. |
| username | User associated with the session. |
| client_addr | IP address or hostname of the client machine initiating the session. |
| application | Name or identifier of the client application establishing the session. |
| backend_start | Timestamp indicating when the session was established. |
| state | Current state of the session, such as "idle", "active", "idle in transaction", "idle in transaction (aborted)", etc. |
| stateChange | Timestamp when the state of a session transitions from one state to another. |
Checkpoint Details
| Metric | Description |
|---|---|
| checkpointSegments | Number of checkpoints performed based on the checkpoint_timeout. |
| checkpointBuffersAlloc | Number of buffers allocated for database operations. |
| checkpointBuffersClean | Number of buffers written by backends during normal database operations. |
| checkpointBuffersBackendFsync | Number of times a backend had to execute its own sync call (normally the background writer handles those even when the backend does its own write). |
Vacuum Details
| Metric | Description |
|---|---|
| autovacuumStatus | Automatic maintenance process is enabled or not. |
| numOfVacuumProgress | if vaccum is running, the pg_stat_progress_vacuum view will contain one row for each backend (including autovacuum worker processes) that is currently vacuuming. |
Lock Details
| Metric | Description |
|---|---|
| Database | Database to which the lock belongs. |
| lockMode | Type of lock mode (AccessShareLock, RowShareLock,etc). |
| lockStatus | Lock is granted or not. |
| waitEvent | Type of wait event. |
| lockType | The type of lock being held, such as relation, transactionid, virtualxid, object, extend, page, tuple, etc. |
| processID | Process ID of the session holding the lock. |
| relationName | Relation (table, index, etc.) on which the lock is held. |