Monitor ElastiCache
ElastiCache
Overview
ElastiCache is the distributed in memory cache environments in the AWS cloud. Amazon ElastiCache supports the Memcached and Redis cache engines.
Prerequisites:
CloudWatch Access for IAM Role
Provide Read only access for CloudWatch to the dedicated IAM Role used for APM. You can use AWS managed polices that addresses many common use cases by providing standalone IAM policies that are created and administered by AWS. Attach this AWS policy CloudWatchReadOnlyAccess to IAM role to get read access for all CloudWatch else create the below custom policy and attach it to IAM.
Required Permissions:
- cloudwatch:GetMetricData,
- elasticache: ListTagsForResource,
- elasticache:DescribeCacheClusters,
- elasticache:DescribeEvents
Metrics list
Host Level Stats
Host level metrics are common for both Redis and Memcached engines
| Metric | Description |
|---|---|
| BytesReadIntoMemcached | The number of bytes that have been read from the network by the cache node. |
| BytesUsedForCacheItems | The number of bytes used to store cache items. |
| BytesWrittenOutFromMemcached | The number of bytes that have been written to the network by the cache node. |
| BytesUsedForHash | The number of bytes currently used by hash tables. |
| CurrConfig | The number of bytes currently used by hash tables |
| EvictedUnfetched | The number of valid items evicted from the least recently used cache (LRU) which were never touched after being set. |
| ExpiredUnfetched | The number of expired items reclaimed from the LRU which were never touched after being set. |
| SlabsMoved | The total number of slab pages that have been moved. |
| NewItems | The number of new items the cache has stored |
| UnusedMemory | The amount of memory not used by data. |
| NewConnections | The number of new connections the cache has received. |
| Reclaimed | The number of expired items the cache evicted to allow space for new writes. |
| Evictions | The number of non-expired items the cache evicted to allow space for new writes. |
| CurrConnections | A count of the number of connections connected to the cache at an instant in time. |
| CurrItems | A count of the number of items currently stored in the cache. |
Redis Node Stats
| Metric | Description |
|---|---|
| ActiveDefragHits | The number of value reallocations per minute performed by the active defragmentation process. |
| AuthenticationFailures | The total number of failed attempts to authenticate to Redis using the AUTH command. |
| BytesUsedForCache | The total number of bytes allocated by Redis for all purposes including the dataset, buffers and so on. |
| BytesReadFromDisk | The total number of bytes read from disk per minute. Supported only for clusters using Data tiering. |
| BytesWrittenToDisk | The total number of bytes written to disk per minute. Supported only for clusters using Data tiering. |
| CommandAuthorizationFailures | The total number of failed attempts by users to run commands they don not have permission to call. |
| CacheHitRate | Indicates the usage efficiency of the Redis instance. |
| CurrVolatileItems | Total number of keys in all databases that have a ttl set. This is derived from the Redis expires statistic, summing all of the keys with a ttl set in the entire keyspace. |
| DatabaseMemoryUsagePercentage | Percentage of the memory for the cluster that is in use. This is calculated using used_memory/maxmemory from Redis INFO. |
| DatabaseMemoryUsageCountedForEvictPercentage | Percentage of the memory for the cluster that is in use, excluding memory used for overhead and COB. |
| DB0AverageTTL | Exposes avg_ttl of DBO from the keyspace statistic of Redis INFO command. Replicas do not expire keys, instead they wait for primary nodes to expire keys. |
| EngineCPUUtilization | Provides CPU utilization of the Redis engine thread |
| GlobalDatastoreReplicationLag | This is the lag between the secondary Regions primary node and the primary Regions primary node. For cluster mode enabled Redis, the lag indicates the maximum delay among the shards. |
| IsMaster | Indicates whether the node is the primary node of current shard/cluster. The metric can be either 0 (not primary) or 1 (primary). |
| KeyAuthorizationFailures | The total number of failed attempts by users to access keys they don not have permission to access. |
| KeysTracked | The number of keys being tracked by Redis key tracking as a percentage of tracking-table-max-keys. Key tracking is used to aid client-side caching and notifies clients when keys are modified. |
| MemoryFragmentationRatio | Indicates the efficiency in the allocation of memory of the Redis engine. |
| NumItemsReadFromDisk | The total number of items retrieved from disk per minute. Supported only for clusters using Data tiering. |
| NumItemsWrittenToDisk | The total number of items written to disk per minute. Supported only for clusters using Data tiering. |
| MasterLinkHealthStatus | This status has two values: 0 or 1. The value 0 indicates that data in the ElastiCache primary node is not in sync |
| ReplicationBytes | For nodes in a replicated configuration, ReplicationBytes reports the number of bytes that the primary is sending to all of its replicas. |
| ReplicationLag | This metric is only applicable for a node running as a read replica. It represents how far behind, in seconds, the replica is in applying changes from the primary node. For Redis engine version 5.0.6 onwards, the lag can be measured in milliseconds. |
| SaveInProgress | This binary metric returns 1 whenever a background save (forked or forkless) is in progress, and 0 otherwise. |
| TrafficManagementActive | Indicates whether ElastiCache for Redis is actively managing traffic by adjusting traffic allocated to incoming commands, monitoring or replication. |
| NewConnections | The number of new connections the cache has received. |
| Reclaimed | The number of expired items the cache evicted to allow space for new writes. |
| Evictions | The number of non-expired items the cache evicted to allow space for new writes. |
| CurrConnections | A count of the number of connections connected to the cache at an instant in time. ElastiCache uses two to three of the connections to monitor the cluster. |
| CurrItems | A count of the number of items currently stored in the cache. |
Redis Operational Stats
| Metric | Description |
|---|---|
| ClusterBasedCmds | The total number of commands that are cluster-based. |
| ClusterBasedCmdsLatency | Latency of cluster-based commands. |
| EvalBasedCmds | The total number of commands for eval-based commands. |
| EvalBasedCmdsLatency | Latency of eval-based commands. |
| GeoSpatialBasedCmds | The total number of commands for geospatial-based commands. |
| GeoSpatialBasedCmdsLatency | Latency of geospatial-based commands. |
| GetTypeCmds | The total number of read-only type commands. |
| GetTypeCmdsLatency | Latency of read commands. |
| HashBasedCmds | The total number of commands that are hash-based. |
| HashBasedCmdsLatency | Latency of hash-based commands. |
| HyperLogLogBasedCmds | The total number of HyperLogLog-based commands. |
| HyperLogLogBasedCmdsLatency | Latency of HyperLogLog-based commands. |
| JsonBasedCmds | The total number of commands that are JSON-based. |
| JsonBasedCmdsLatency | Exposes the aggregate latency (server side CPU time) calculated as Delta[Usec]/Delta[Calls] of all commands that act upon one or more JSON document objects. |
| KeyBasedCmds | The total number of commands that are key-based. |
| KeyBasedCmdsLatency | Latency of key-based commands. |
| ListBasedCmds | The total number of commands that are list-based. |
| ListBasedCmdsLatency | Latency of list-based commands. |
| PubSubBasedCmds | The total number of commands for pub/sub functionality. |
| PubSubBasedCmdsLatency | Latency of pub/sub-based commands. |
| SetBasedCmds | The total number of commands that are set-based. |
| SetBasedCmdsLatency | Latency of set-based commands. |
| SetTypeCmds | The total number of write types of commands. |
| SetTypeCmdsLatency | Latency of write commands. |
| SortedSetBasedCmds | The total number of commands that are sorted set-based. |
| SortedSetBasedCmdsLatency | Latency of sorted-based commands. |
| StringBasedCmds | The total number of commands that are string-based. |
| StringBasedCmdsLatency | Latency of string-based commands. |
| StreamBasedCmds | The total number of commands that are stream-based. |
| StreamBasedCmdsLatency | Latency of stream-based commands. |
Memcached System Stats
| Metric | Description |
|---|---|
| BytesReadIntoMemcached | The number of bytes that have been read from the network by the cache node. |
| BytesUsedForCacheItems | The number of bytes used to store cache items. |
| BytesWrittenOutFromMemcached | The number of bytes that have been written to the network by the cache node. |
| BytesUsedForHash | The number of bytes currently used by hash tables. |
| CurrConfig | The current number of configurations stored. |
| EvictedUnfetched | The number of valid items evicted from the least recently used cache (LRU) which were never touched after being set. |
| ExpiredUnfetched | The number of expired items reclaimed from the LRU which were never touched after being set. |
| SlabsMoved | The total number of slab pages that have been moved. |
| NewItems | The number of new items the cache has stored |
| UnusedMemory | The amount of memory not used by data. |
| NewConnections | The number of new connections the cache has received. |
| Reclaimed | The number of expired items the cache evicted to allow space for new writes. |
| Evictions | The number of non-expired items the cache evicted to allow space for new writes. |
| CurrConnections | A count of the number of connections connected to the cache at an instant in time. |
| CurrItems | A count of the number of items currently stored in the cache. |
Memcached Operational Stats
| Metric | Description |
|---|---|
| DecrHits | The number of decrement requests the cache has received where the requested key was found. |
| DecrMisses | The number of decrement requests the cache has received where the requested key was not found. |
| DeleteHits | The number of delete requests the cache has received where the requested key was found. |
| DeleteMisses | The number of delete requests the cache has received where the requested key was not found. |
| GetHits | The number of get requests the cache has received where the key requested was found. |
| GetMisses | The number of get requests the cache has received where the key requested was not found. |
| IncrHits | The number of increment requests the cache has received where the key requested was found. |
| IncrMisses | The number of increment requests the cache has received where the key requested was not found. |
| TouchHits | The number of keys that have been touched and were given a new expiration time. |
| TouchMisses | The number of items that have been touched, but were not found. |
| CasHits | The number of Cas requests the cache has received where the requested key was found and the Cas value matched. |
| CasMisses | The number of Cas requests the cache has received where the key requested was not found. |
| CmdFlush | The number of flush commands the cache has received. |
| CmdGet | The number of get commands the cache has received. |
| CmdSet | The number of set commands the cache has received. |
| CmdConfigGet | The cumulative number of config get requests. |
| CmdConfigSet | The cumulative number of config set requests. |
| CmdTouch | The cumulative number of touch requests. |
| CasBadval | The number of CAS (check and set) requests the cache has received where the Cas value did not match the Cas value stored. |
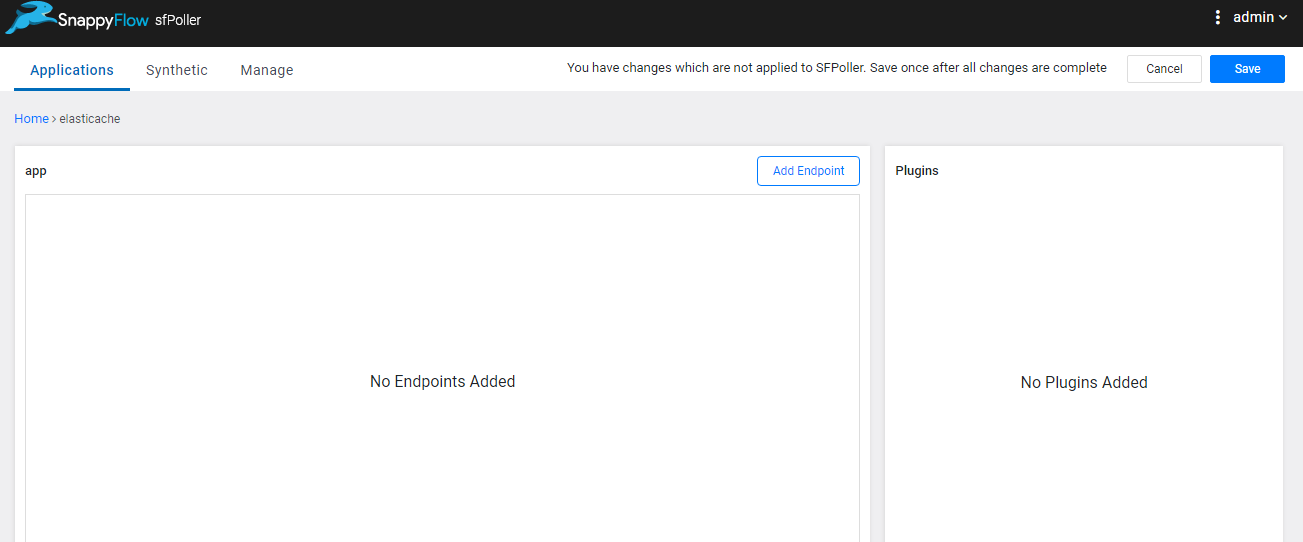
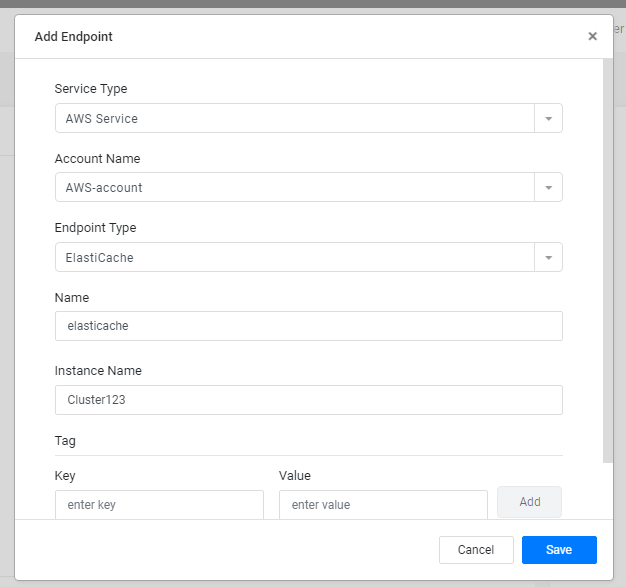
sfPoller Configuration
Select ElastiCache Endpoint Type in Add Endpoints and add the Cluster Name
Add Endpoint
Select ElastiCache Endpoint
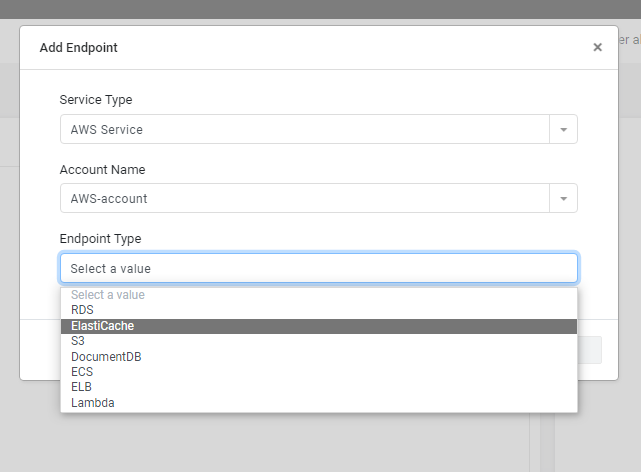
Enter the ClusterName
Select the plugin from the dropdown under Plugins tab and config the polling interval. Plugin configuration for ElastiCache services this includes cloudwatch-elasticache-redis and cloudwatch-elasticache-memcached plugin. You can enable/disable any of the plugin based on your needs and instance support.
cloudwatch-elasticache-redis:
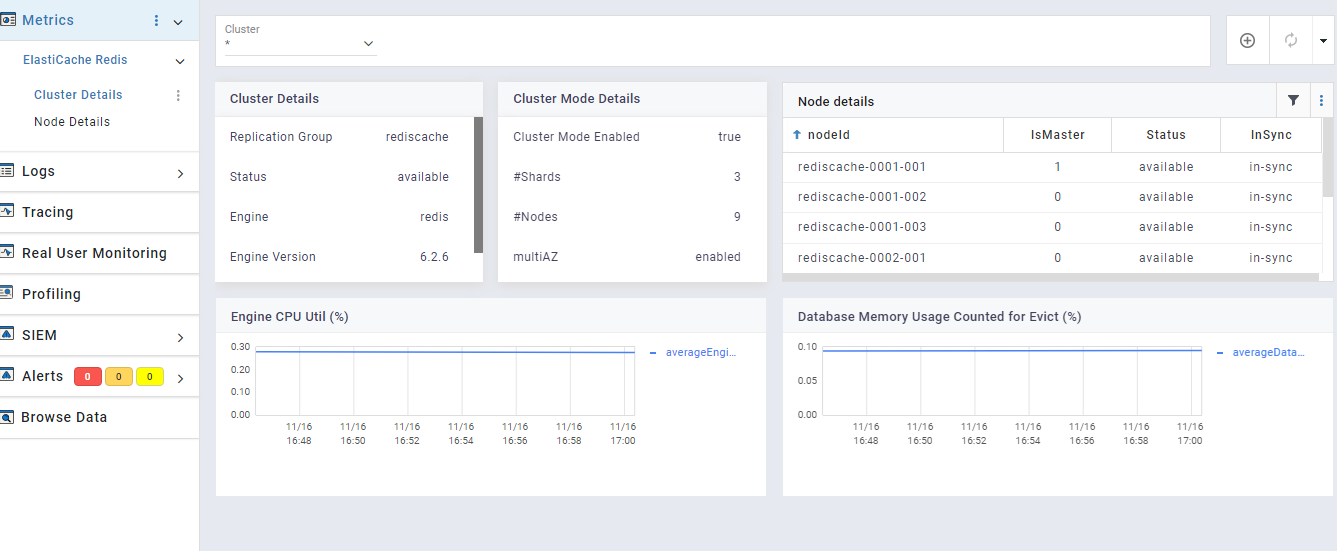
a monitoring support for AWS ElastiCache Redis Cluster, collects all the hostlevel, node level and operational stats of a redis cluster.
cloudwatch-elasticache-memcached:
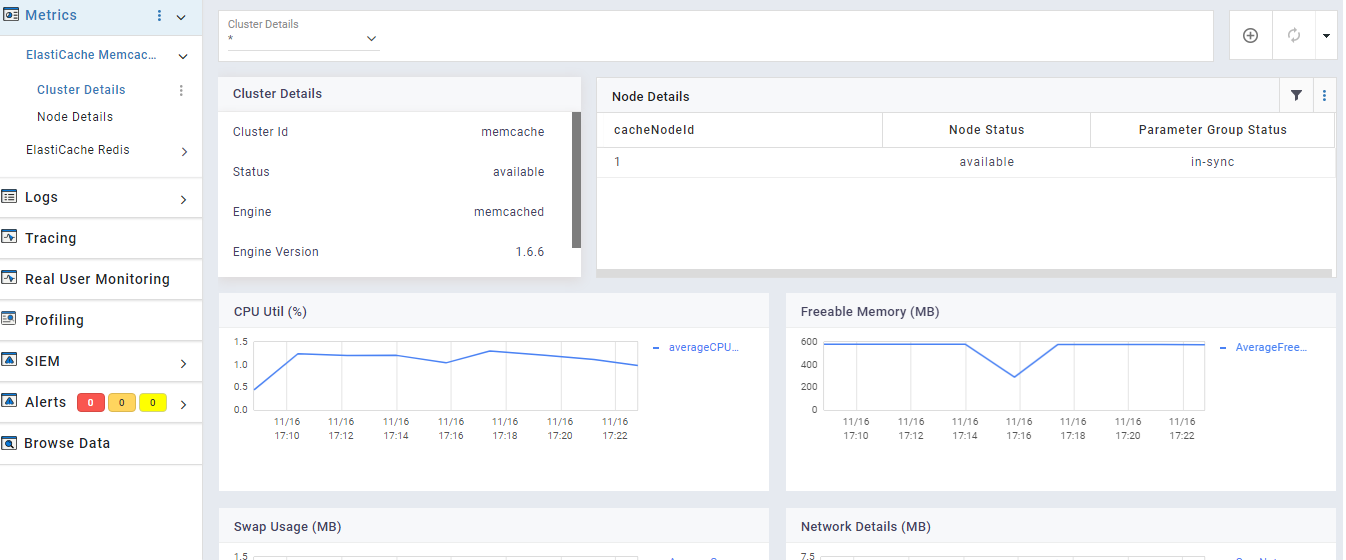
a monitoring support for AWS ElastiCache memcached Cluster, collects all the hostlevel, system level and operational stats of a memcached cluster.
View Data and Dashboards
All CloudWatch metrics are collected and tagged based on their ElastiaCache type to get displayed in their respective dashboard template. Use ElastiCache_Redis or ElastiCache_Memcached for data visualization as per the Engine.