Monitor Jenkins
Overview
The Jenkins plugin enhances the ability to monitor Jenkins operations, providing a comprehensive perspective on nodes by collecting node information, metrics, event reports, job performance data, and their real-time statuses.
This plugin facilitates automated forwarding of metrics and service checks to APM Snappyflow (leveraging Elasticsearch and Kafka). It simplifies the process of gaining insight into the Jenkins CI/CD pipeline in four steps:
Gathering Data from Jenkins.
Indexing and Storing Data in Snappyflow (utilizing Elasticsearch and Kafka).
Visualization through Snappyflow Dashboards.
User Alerting.
Prerequisite
To collect the metrics of the plugin it is necessary to have the below details.
APM host URL and Port.
Create a project and application in SnappyFlow APM and generate profile key.If you've already created these, you can utilize the existing information.
Snappyflow APM requires the auth token, kafka path and kafka topic details (The SnappyFlow team will provide these details).
Configuration
Steps to Add SnappyFlow Plugin
Open the Jenkins dashboard and select
Manage Jenkinsoption.In the Plugins section, go to Available Plugins and search
Maplelabs APM.
Select the
Maplelabs APMoption and install the plugin.Once the installation is complete, restart Jenkins.
Steps to Add Plugin onfiguration
To configure the SnappyFlow Jenkins plugin:
Go to the Manage Jenkins > System Configuration section.
In the System Configuration section, select the
Systemoption.In the System window, scroll down and go to APM Maplelabs Plugin section and add the following details:
Give the details of Host:
Target url, Port:Port numberand Protocol:Protocol used for communication details.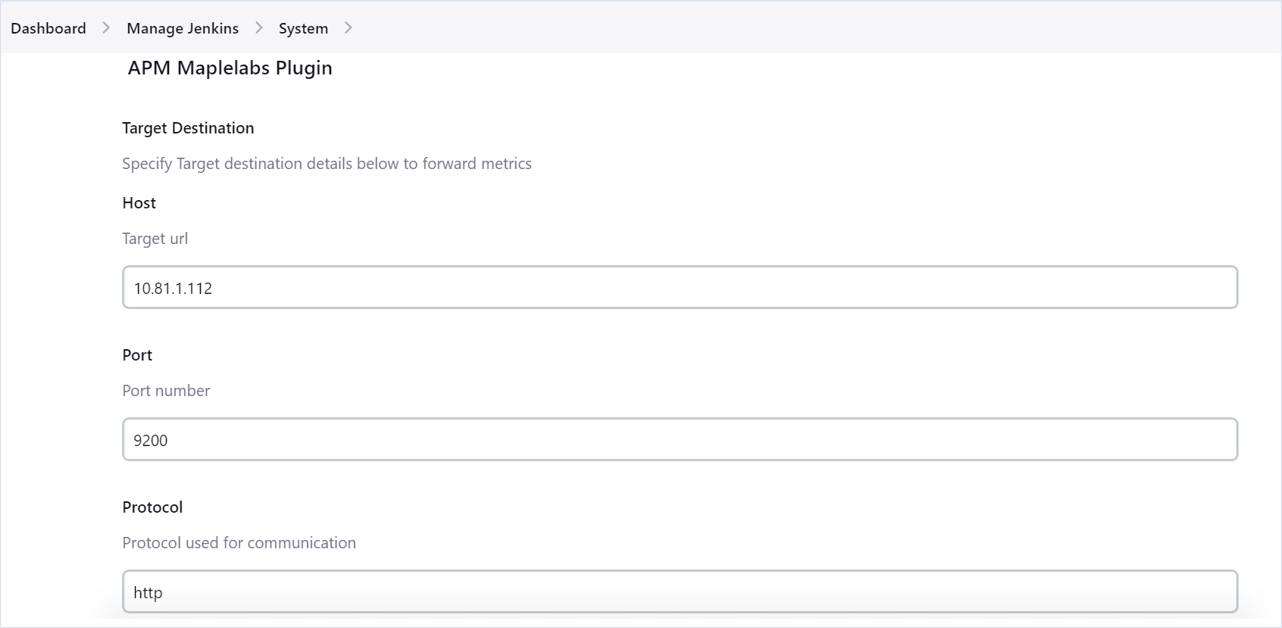
Provide the snappyflow details like
Snappyflow Project Name,Snappyflow Application Name,SnappyFlow Instance NameandProfile.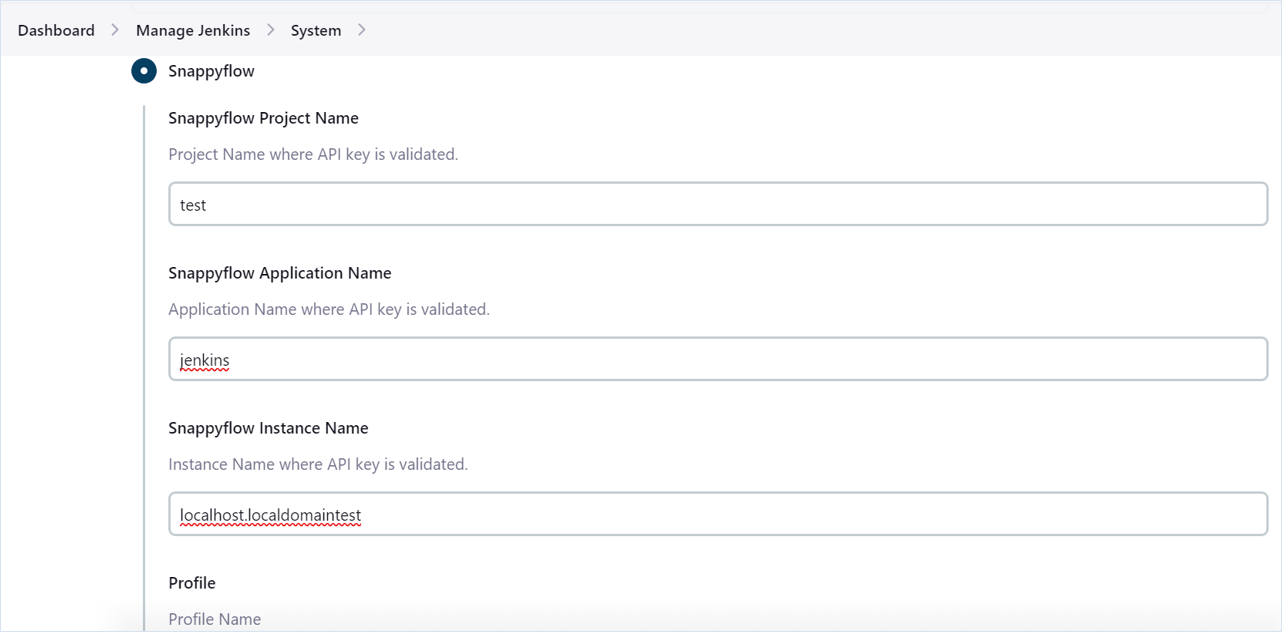
Select SnappyFlow Kafka and give following details:
taken,Path, andKafka Topic.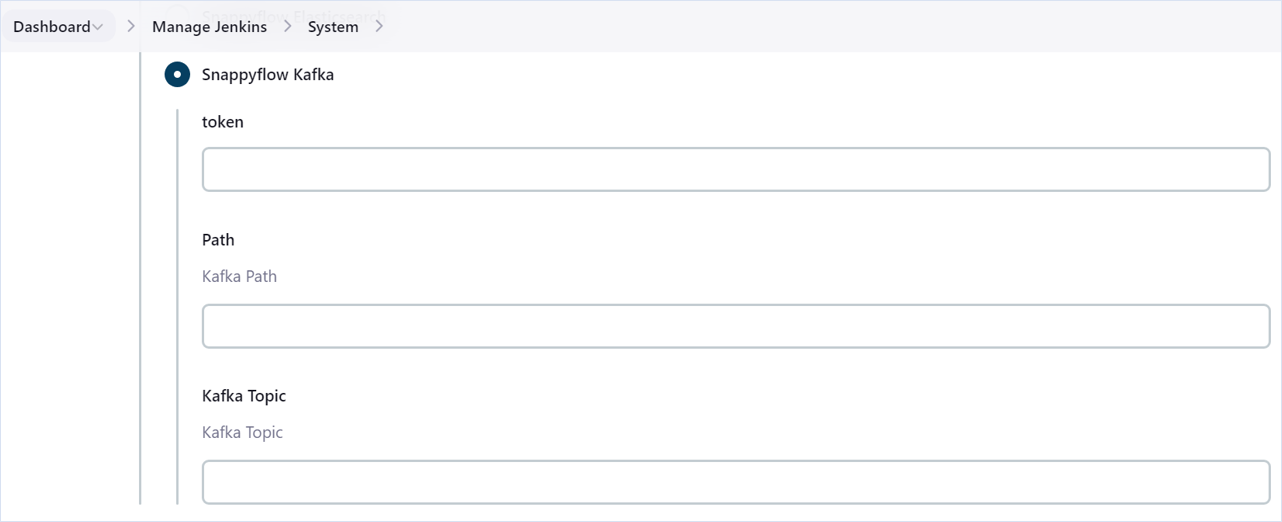
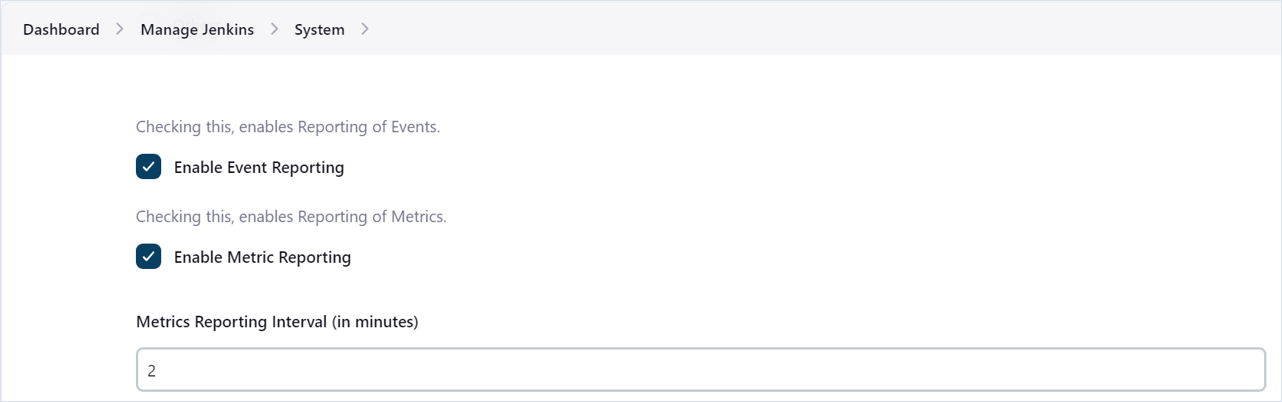
Check the check boxes of Enable Event Reporting and Enable Metric Reporting. Give a Metrics Reporting Interval in minutes.
Select
SaveandApplybutton.The data will be shown in SnappyFlow dashboard after the time interval mentioned in the Jenkins.
If any change in the reporting interval is made, Jenkins must be restarted to apply the changes.
View Jenkins Metrics
Follow the below steps to view the metrics collected from Jenkins.
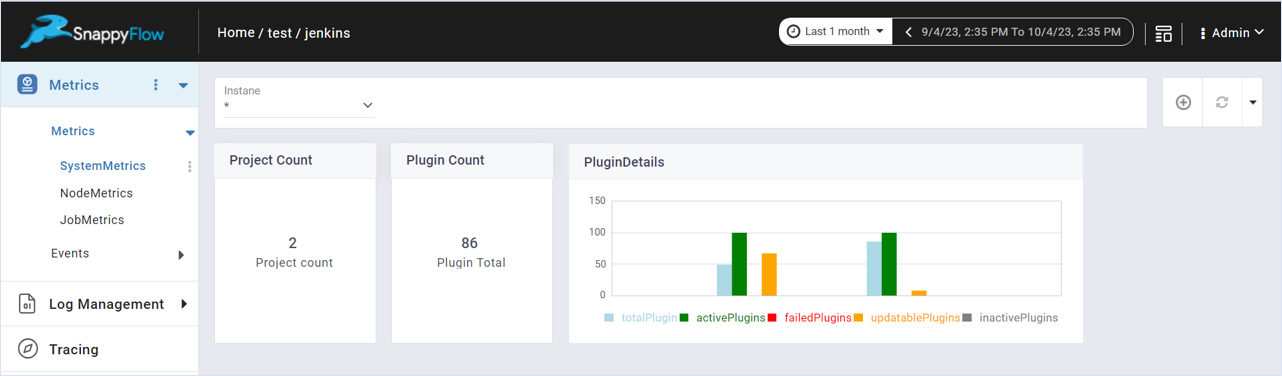
- Go to the Application tab in SnappyFlow and navigate to your Project > Application > Dashboard.
- You can view the APIGateway metrics in the Metrics section.
Once the configuration is complete, the plugin will be automatically detected within the Metrics section. However, if the plugins are not detected, you can import template to view the corresponding metrics and events.
- To access the unprocessed data gathered from the plugins, navigate to the Browse data section and choose the
Index: Metric,Instance: Endpoint,Plugin,andDocument Type.
Template Details
| Template | Plugin | Document Type | Description |
|---|---|---|---|
| Metrics | Jenkins | jobMetrics, nodeMetrics, systemMetrics | Collects metrics from Jenkins. |
| Events | Jenkins | jobEvents, systemEvents, securityEvents | Collects event information from Jenkins. |
Metric List
System Metrics
| Metric | Description |
|---|---|
| project_total | Total No. of projects on the Jenkins Instance. |
| plugin_total | Total Plugins Installed on Jenkins Instance. |
| plugins_active | Count of active plugins. |
| plugins_failed | Count of failed plugins. |
| plugins_inactive | Count of inactive plugins. |
| plugins_updatable | Count of updatable plugins. |
Node Metrics
| Metric | Description |
|---|---|
| nodeName | Name of the Node. |
| executorCount | No. of executors on the node. |
| free | No. of free executors. |
| inUse | No. of inUse executors. |
| connectTime | Connect Time of this Node. |
| swap_total_in_GB | Total number of swap space in GB. |
| swap_available_in_GB | Available swap space in GB. |
| memory_total_in_GB | Total physical memory of the system, in GB. |
| memory_available_in_GB | The available memory of the system's total physical memory, in GB. |
| disk_path | The path that was checked. |
| disk_available_GB | Available Disk size in GB. |
| temp_path | Monitors the disk space of "/tmp" path. |
| temp_available_GB | Available size of "/tmp" in GB. |
| response_time | Computes the average response time, by taking the time out into account. |
| arch | Discovers the architecture of the system. |
| nodes_total | Total Nodes available. |
Job Metrics
| Metric | Description |
|---|---|
| queue_size | No. of items in queue |
| queue_stuck | No. of items stuck in queue starving for an executor for too long |
| queue_buildable | No. of items waiting the executor to become available |
| queue_blocked | No. of items blocked because another build is in progress, required Resources are not available or otherwise blocked by Queue.Task.isBuildBlocked() |
| queue_pending | No. of items currently pending execution |
| jobs_started | No. of jobs started (History of jobs) |
| jobs_aborted | No. of jobs aborted |
| jobs_completed | No. of jobs completed |
Job Events
| Metric | Description |
|---|---|
| onStarted | Notifies the start of a build. |
| onCompleted | Notifies the completion & status of a build. |
System Events
| Metric | Description |
|---|---|
| onOffline | Called right after a computer went offline. |
| onTemporarilyOffline | Indicates that the computer was marked as temporarily offline by the administrator. |
| onTemporarilyOnline | Indicates that the computer was marked as temporarily online by the administrator. |
| onLaunchFailure | Called when an agent attempted to connect via ComputerLauncher but it failed. |
Security Events
| Metric | Description |
|---|---|
| userCreated | Notifies User creation. |
| authenticated2 | Fired when a user was successfully authenticated using credentials. |
| failedToAuthenticate | Fired when a user tried to authenticate but failed. |
| loggedIn | Fired when a user has logged in. |
| failedToLogIn | Fired when a user has failed to log in. |
| loggedOut | Fired when a user logs out. |
Enable Alerts and Notofications
To set alerts and notifications for Jenkins plugin click here.