Monitor AWS Managed Workflows for Apache Airflow
Overview
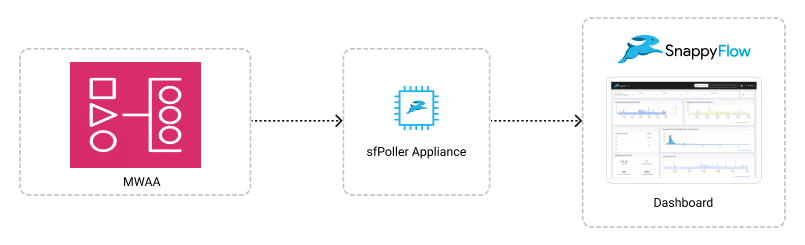
The Amazon Managed Workflows for Apache Airflow (MWAA) Plugin of SnappyFlow collects MWAA metrics and logs from CloudWatch and visualize them within SnappyFlow dashboard. This integration is designed to give you comprehensive insights about MWAA.
Prerequisite
To collect metrics from MWAA, it is necessary to have an IAM Role with CloudWatch access and sfPoller set up within your AWS environment. Click here to learn more about setting up sfPoller in your AWS environment.
Create CloudWatch Access for IAM Role
Sign in to the AWS Management Console and open the IAM console at https://console.aws.amazon.com/iam/.
Follow the below steps to create a policy in the IAM console.
Navigate to Access Management > Policies
In the Create policy window, go to the JSON tab
Copy and paste the below-mentioned JSON code into the policy editor
{
   "Version": "2012-10-17",
   "Statement": [
       {
         "Sid": "VisualEditor0",
         "Effect": "Allow",
         "Action": [
                    "MWAA: ListEnvironments",
                    "MWAA: GetEnvironment",
                    "MWAA: ListTagsForResource",
                ],
        },
    ],
 }
Click the
Next: Tags>Next: ReviewbuttonIn the Review policy window, give the Name and Description (Optional) for the policy and review the list of permissions
Click the
Create policybuttonAttach the policy to a dedicated IAM Role for read-only access
TaskID and DagID are obtained from Task Logs Stream Names. Therefore, to gather data on TaskLevel, TaskStateLevel, and DagLevel metrics, users must enable CloudWatch Task Logs.
Configure sfPoller to Collect Metrics
Follow the below step to add endpoints and plugins in sfPoller.
Go to the Application tab of sfPoller and navigate to your Project > Application.
Select the Application, it will take you to the
Endpointpage.In the Endpoint page, select the
Add Endpointbutton, add the following data, and save.- Service Type: Select
AWS Service - Account Name:
aws - Endpoint Type:
MWAA - Name: Give a meaningful name to the endpoint
- Instance Name: Give the table name as the instance name
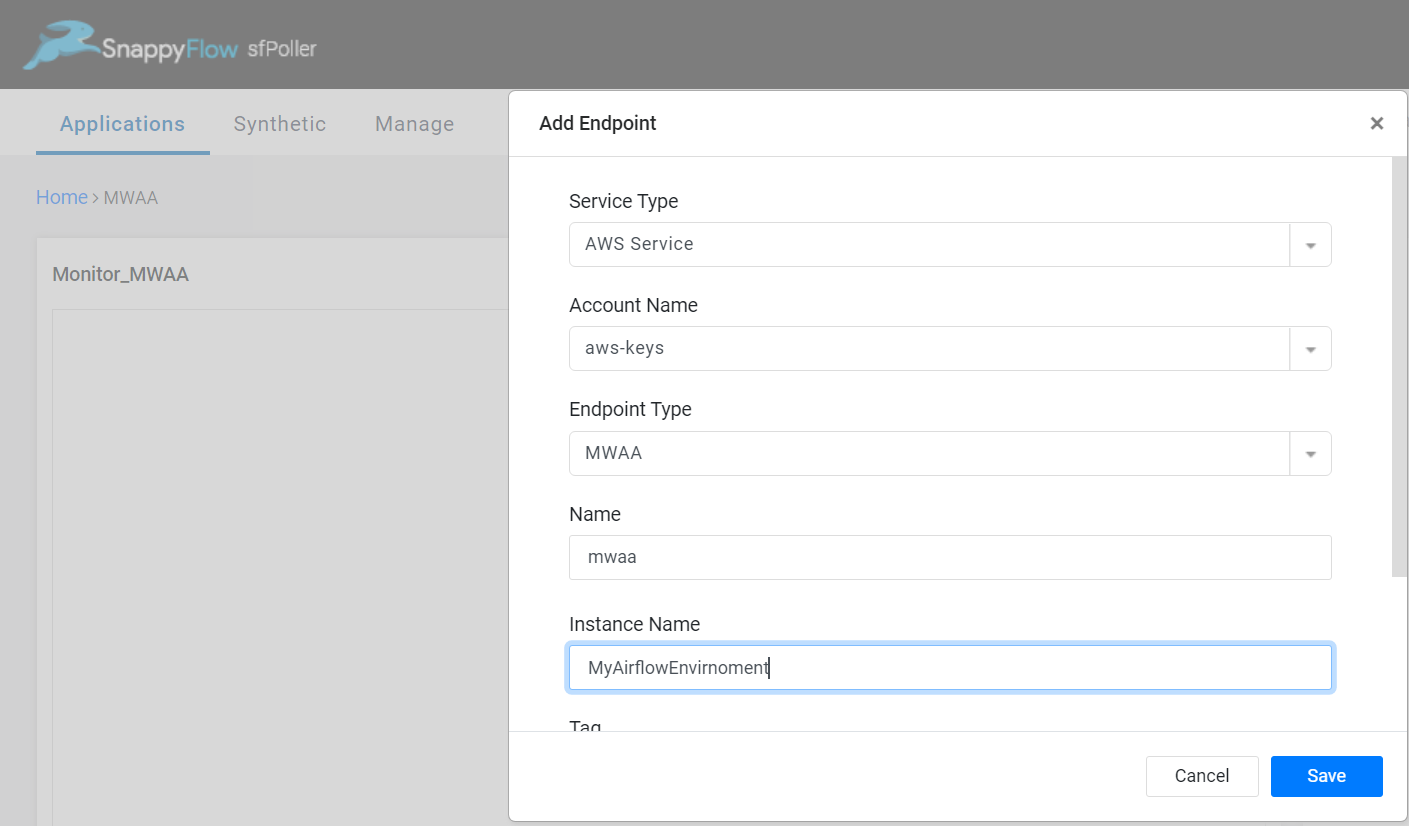
- Service Type: Select
In the Plugins window, select the
+Addbutton.In the Add Plugin window, select the below details.
- Plugin Type:
Metric - Plugin:
cloudwatch-mwaa - Interval: Choose an interval value. The minimum value for the interval is 300
- Status: By default, the status is
Enabled
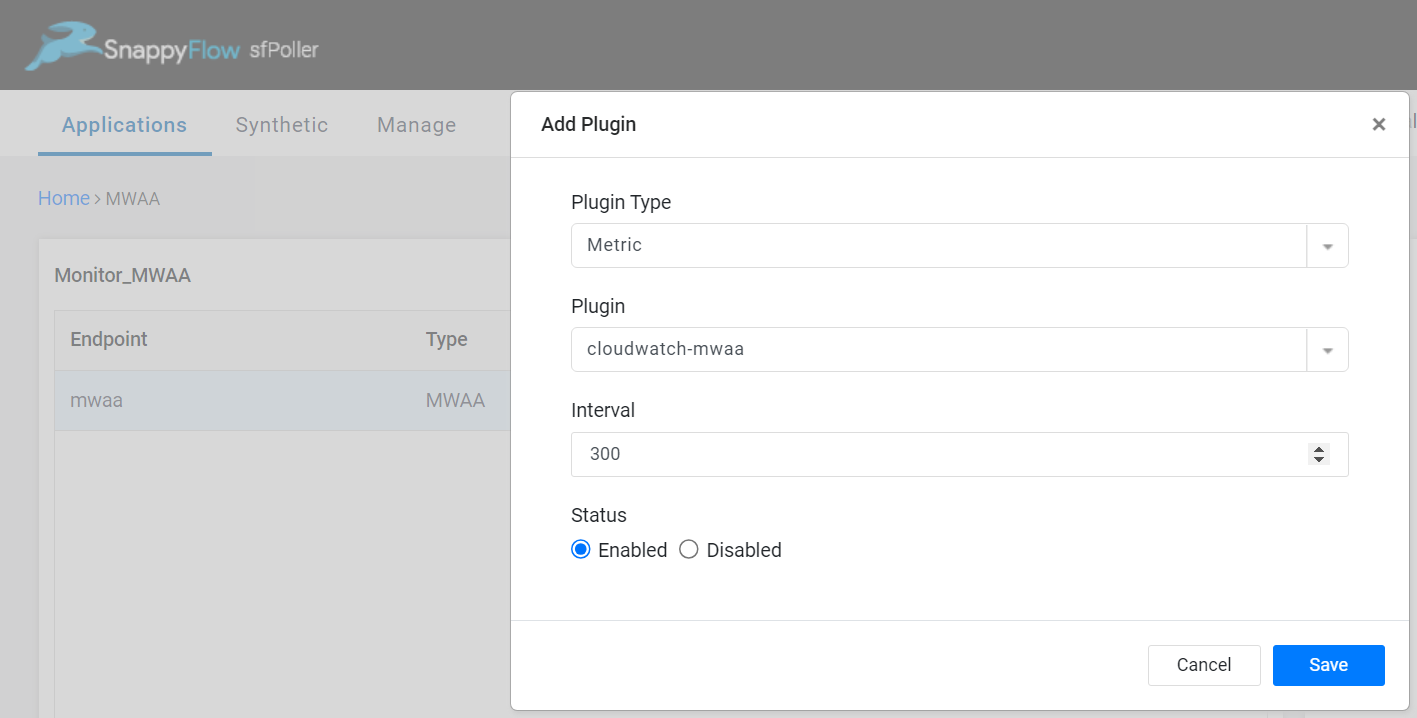
- Plugin Type:
Select the
Savebutton.Again select the
+Addbutton and in the Add Plugin window, add below details to collect logs of MWAA.- Plugin Type:
Logger - Plugin:
cloudwatch-mwaa-log - Interval: Choose an interval value. The minimum value for the interval is 300
- Status: By default, the status is
Enabled
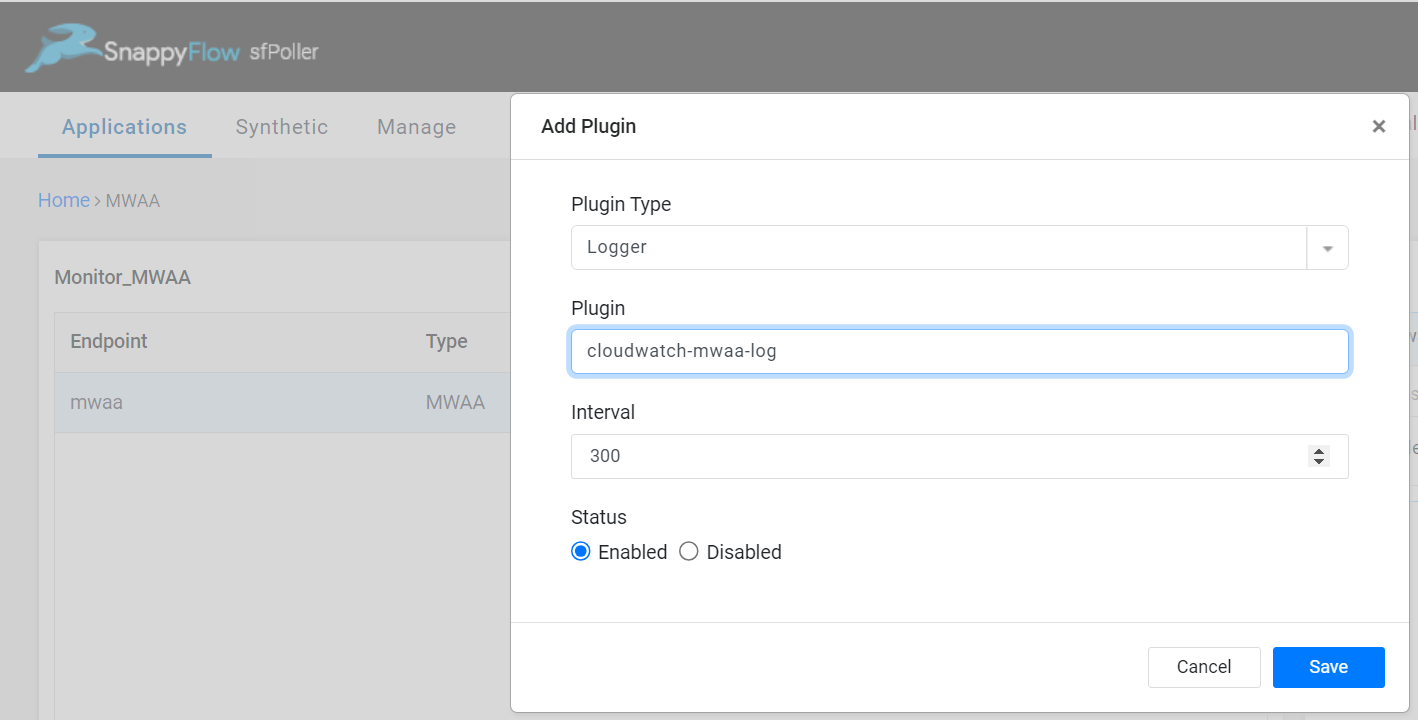
- Plugin Type:
Select the
Savebutton.Click the global
Savebutton in the window's top right corner to save all the changes made so far.
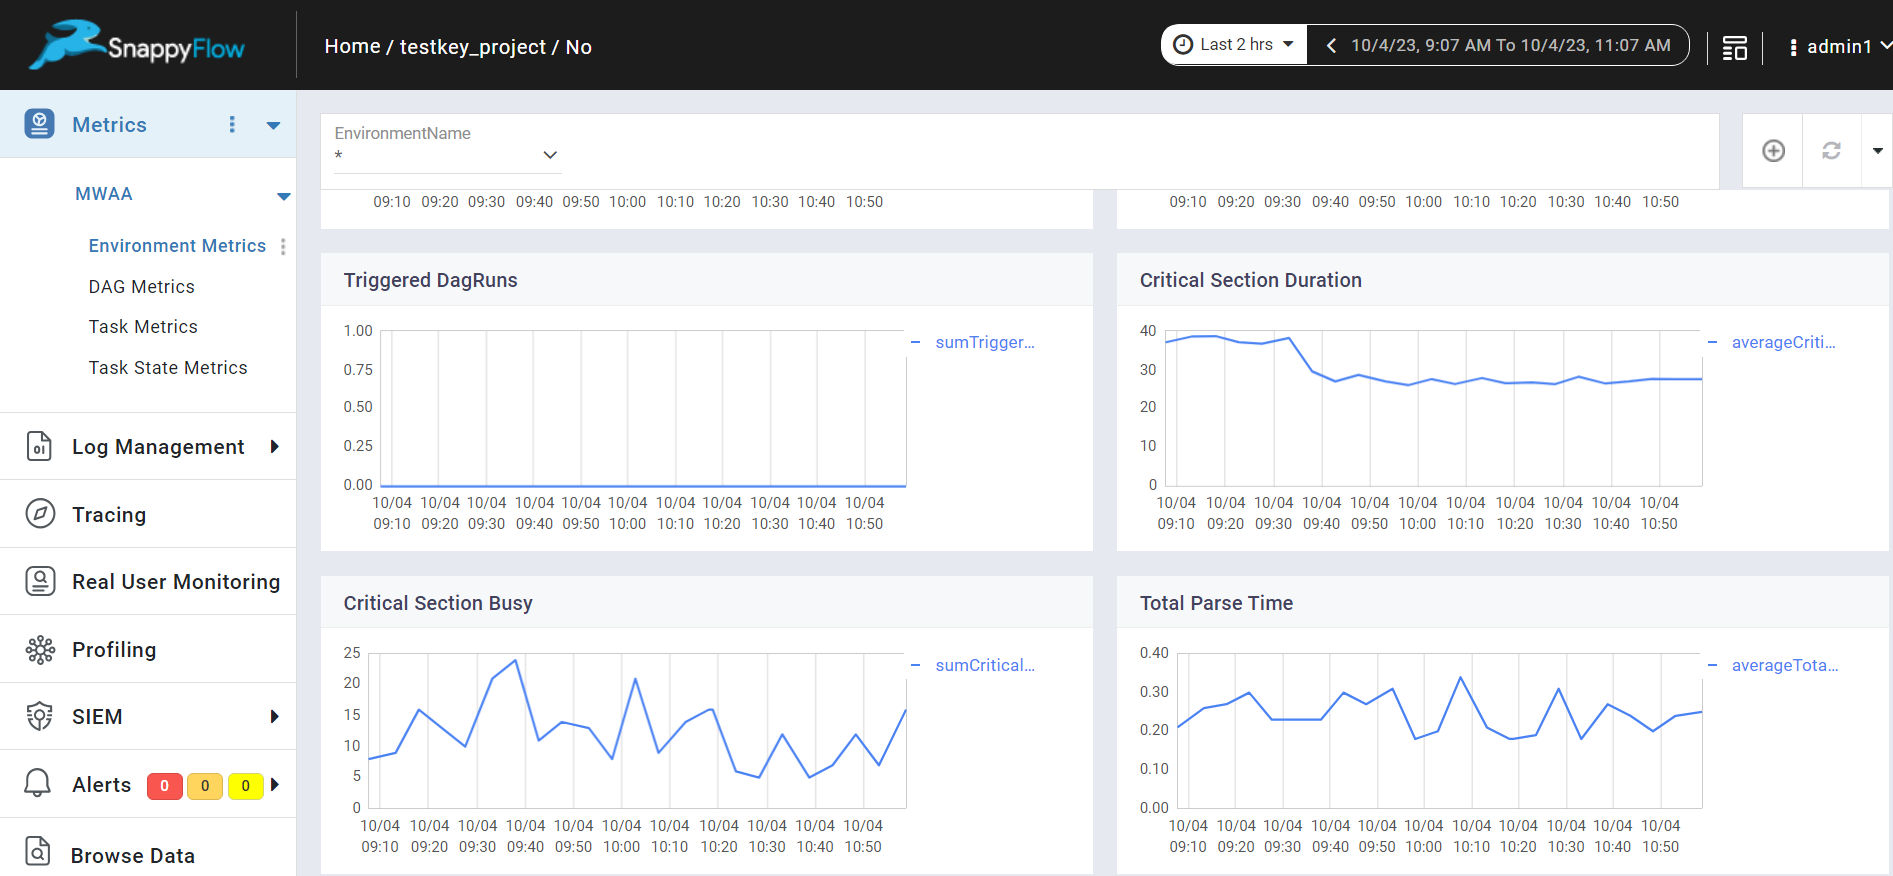
View MWAA Metrics and Logs
Follow the below steps to view the metrics collected from MWAA.
Go to the Application tab in SnappyFlow and navigate to your Project > Application > Dashboard.
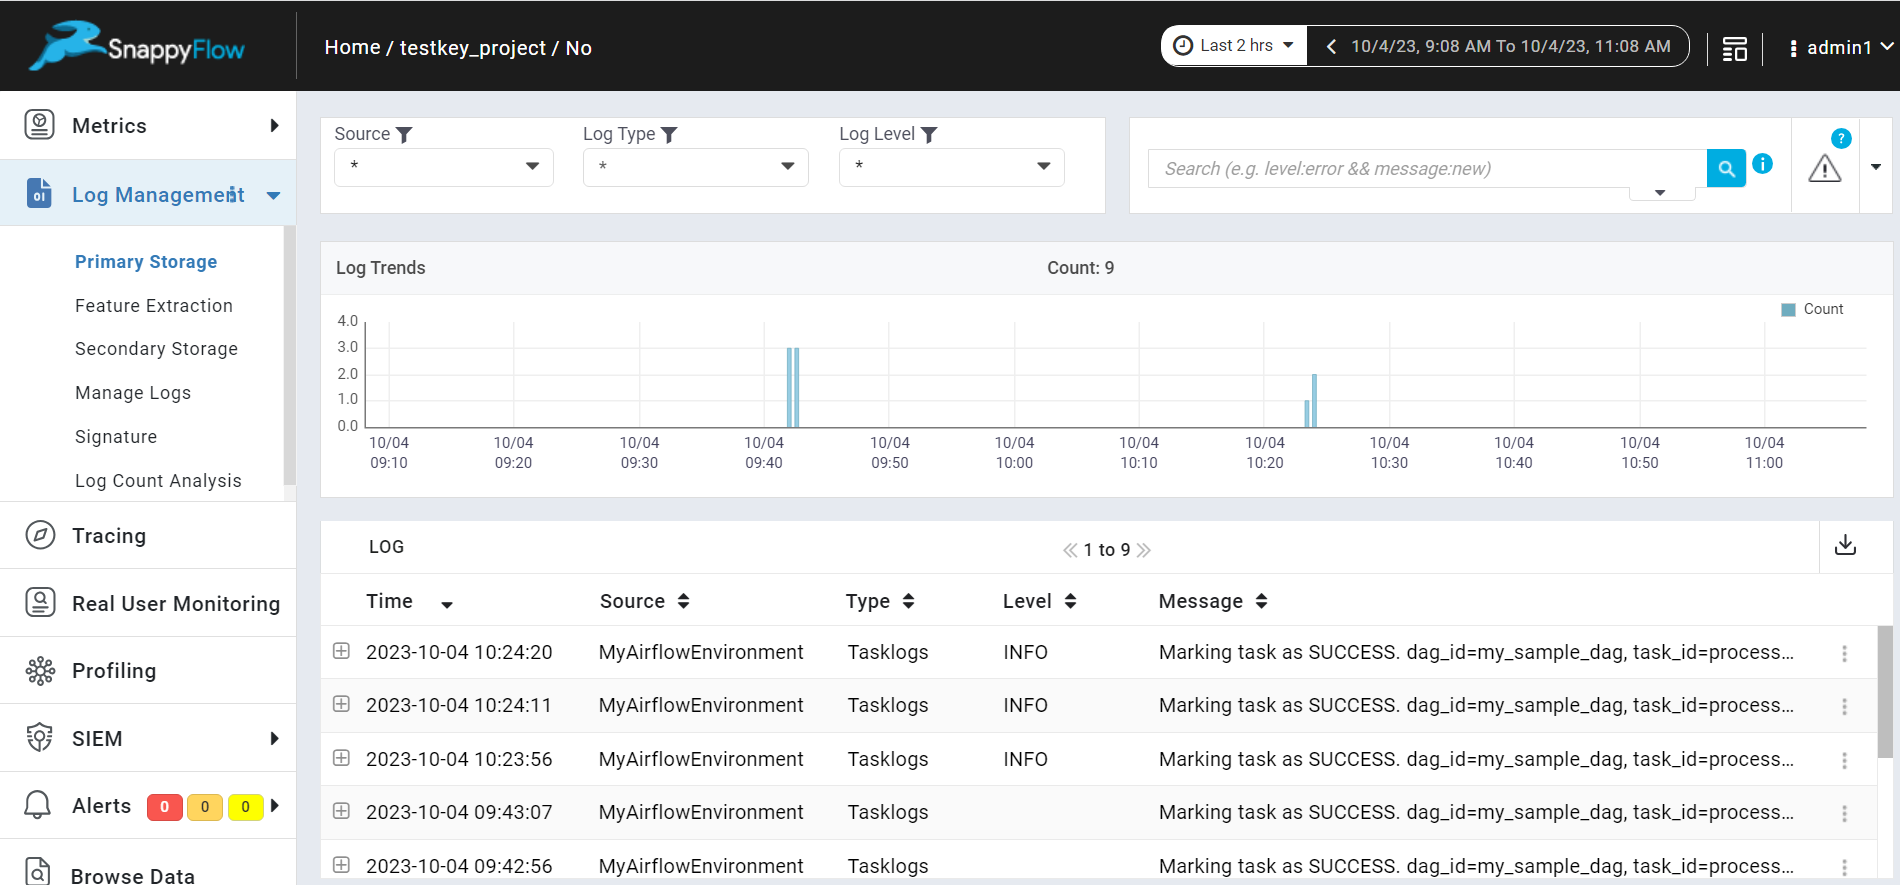
You can view the MWAA metrics in the Metrics section and logs in the Log Management section.
noteOnce plugin is added to sfPoller, they will be automatically detected within the Metrics and log management section. However, if the plugins are not detected, you can import template to view the corresponding metrics and logs.
To access the unprocessed data gathered from the plugins, navigate to the Browse data section and choose the
Index: Metric,Instance: Endpoint,Plugin,andDocument Type.
Template Details
| Template | Plugin | Document Type | Description |
|---|---|---|---|
| MWAA | cloudwatch-mwaa | EnvironmentLevel, FunctionLevel, DagIDLevel, TaskLevel, TaskStateLevel | Collects metrics from MWAA |
Metric List
Environment Level
| Metric | Description |
|---|---|
| TaskInstanceFailures | Count of task instances that have failed during execution. A task instance represents a specific execution of a task within a workflow. |
| TaskInstanceSuccesses | Count of task instances that have successfully completed during execution. It indicates the number of task executions that ended without errors. |
| ZombiesKilled | Count of zombie task instances that have been detected and killed during execution. Zombie tasks are those that are not properly managed by Airflow, and killing them helps maintain workflow integrity. |
| DagCallbackExceptions | Count of exceptions encountered during the execution of DAG (Directed Acyclic Graph) callback functions. Callback functions are user-defined functions that can be executed at various points in the workflow. |
Function Level
| Metric | Description |
|---|---|
| CriticalSectionBusy | Count of times a critical section, which is a region of code that must be executed atomically, has been busy or locked. This metric can indicate potential contention for critical resources. |
| DagBagSize | Count representing the size of the DAG (Directed Acyclic Graph) bag, which holds all the DAGs available to Airflow. It indicates the number of DAGs currently loaded into Airflow. |
| ImportErrors | Count of import errors encountered during the loading of DAGs or other Python modules. Import errors can indicate issues with module availability or compatibility. |
| TotalParseTime | Average time (in seconds), taken to parse a DAG definition file. It measures the time required for Airflow to read and interpret the DAG configuration. |
| TasksExecutable | Maximum count of tasks that are considered executable and ready for execution. It represents the peak concurrency of executable tasks. |
| TasksRunning | Average count of tasks that are currently running or actively executing. It provides insight into the average task concurrency. |
| TasksStarving | Maximum count of tasks that are waiting for resources or dependencies before they can start execution. It highlights peak periods of potential resource contention. |
| CriticalSectionDuration | Average duration (in milliseconds), spent in critical sections. Critical sections are regions of code that must be executed atomically, and this metric helps assess their efficiency. |
| ProcessorTimeouts | Count of processor timeouts, indicating the number of times a task execution exceeded its allotted time and triggered a timeout. |
| QueuedTasks | Count of tasks that are currently queued and waiting for execution. It helps assess the workload backlog. |
| RunningTasks | Count of tasks that are currently in the running state, actively executing. It provides insight into current task concurrency. |
| OpenSlots | Minimum count of available execution slots for tasks. It represents the lowest number of available resources during a period. |
| OrphanedTasksAdopted | Maximum count of orphaned tasks that have been adopted and assigned to an executor for execution. |
| OrphanedTasksCleared | Maximum count of orphaned tasks that have been cleared or removed from the execution queue. |
| TriggeredDagRuns | Count of DAG runs that have been triggered. A DAG run represents the execution of a DAG. |
Dag Level
| Metric | Description |
|---|---|
| DAGDurationSuccess | Average duration (in milliseconds) of successful DAG runs. It measures the time taken for successful DAG executions. |
| DAGScheduleDelay | Average delay (in milliseconds) between the scheduled start time and the actual start time of DAG runs. It helps assess scheduling efficiency. |
| FirstTaskSchedulingDelay | Average delay (in milliseconds) before the first task within a DAG is scheduled for execution. It provides insights into DAG initiation. |
| DAGDependencyCheck | Average time (in milliseconds) spent on checking task dependencies within a DAG. It measures the time required for dependency resolution. |
| DAGDurationFailed | Average duration (in milliseconds) of failed DAG runs. It measures the time taken for DAG executions that ended in failure. |
Task State Level
| Metric | Description |
|---|---|
| TaskInstanceFinished | Sum of task instances that have finished execution. It represents the total count of completed task instances. |
Task Level
| Metric | Description |
|---|---|
| TaskInstanceDuration | Average duration (in milliseconds) of task instances. It measures the typical time spent on task execution, accounting for variations. |
| TaskInstanceStarted | Sum represents the total count of started task instances, offering insights into task initiation rates. |