Monitor AWS API Gateway
Overview
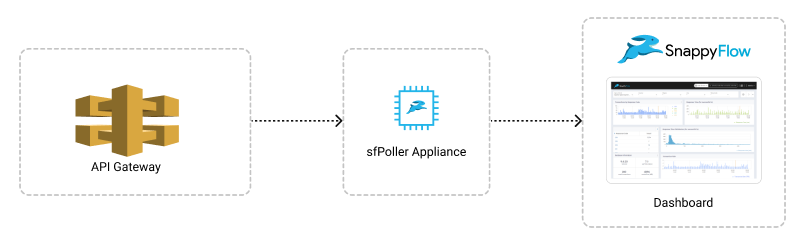
The APIGateway plugin of SnappyFlow collects detailed metrics of AWS APIGateway, such as API call volume, request fulfillment, errors, and latency counts. The collected information is visualized on the SnappyFlow dashboard, making it easy for you to understand and troubleshoot your APIs.
Prerequisite
To collect metrics from API Gateway, it is necessary to have an IAM Role with CloudWatch access and sfPoller set up within your AWS environment. Click here to learn more about setting up sfPoller in your AWS environment.
Create a Policy to Access API Gateway
Sign in to the AWS Management Console and open the IAM console at https://console.aws.amazon.com/iam/.
Follow the below steps to create a policy in the IAM console.
Navigate to Access Management > Policies
In the Create policy window, go to the JSON tab
Copy and paste the below-mentioned JSON code into the policy editor
 {
   "Version": "2012-10-17",
   "Statement": [
       {
         "Sid": "VisualEditor0",
         "Effect": "Allow",
         "Action": [
                    "apigateway:GET",
                    "apigateway:GET_RESOURCE",
                    "apigateway:GET_STAGE",
                    "apigateway:UPDATE_STAGE" ,
                    ],
         },
     ],
 }
Click the
Next: Tags>Next: ReviewbuttonIn the Review policy window, give the Name and Description (Optional) for the policy and review the list of permissions
Click the
Create policybuttonAttach the policy to a dedicated IAM Role for read-only access
Configure sfPoller to Collect Metrics
Follow the below step to add endpoints and plugins in sfPoller.
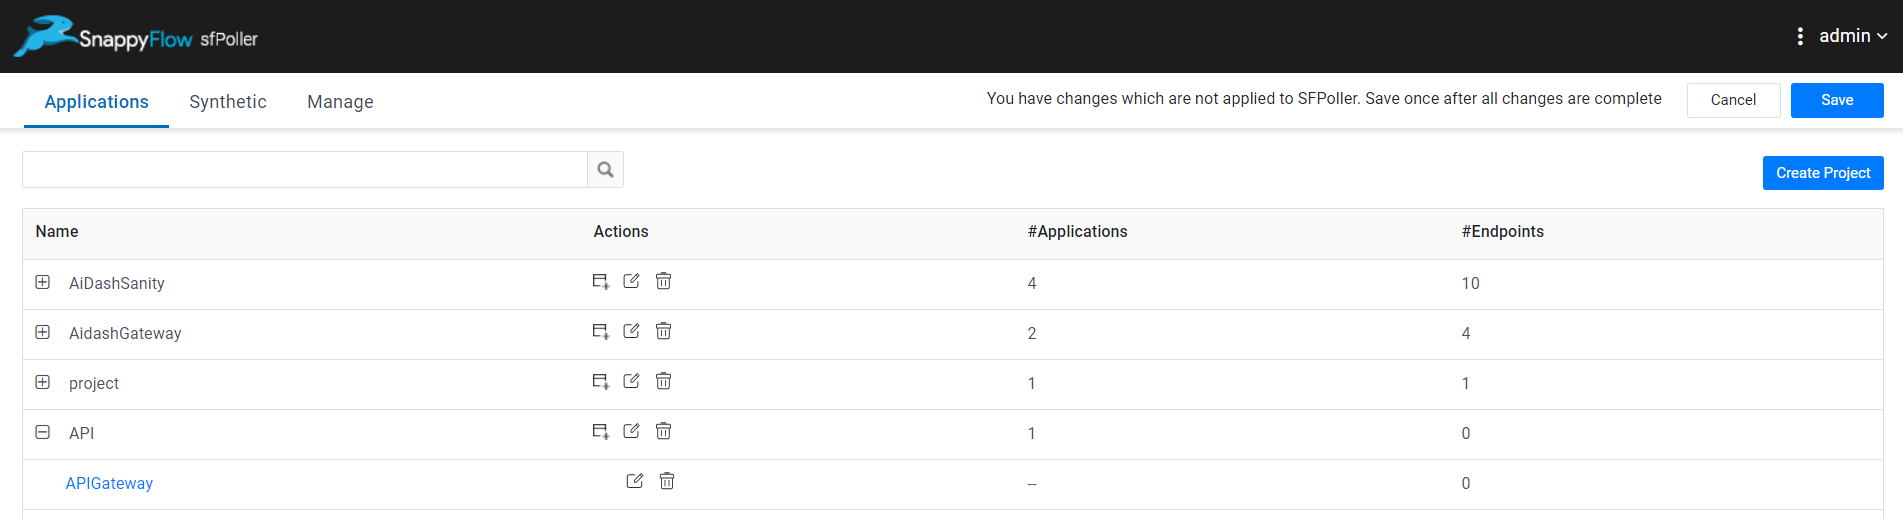
Go to the Application tab of sfPoller and navigate to your Project > Application.
Select the Application, it will take you to the
Endpointpage.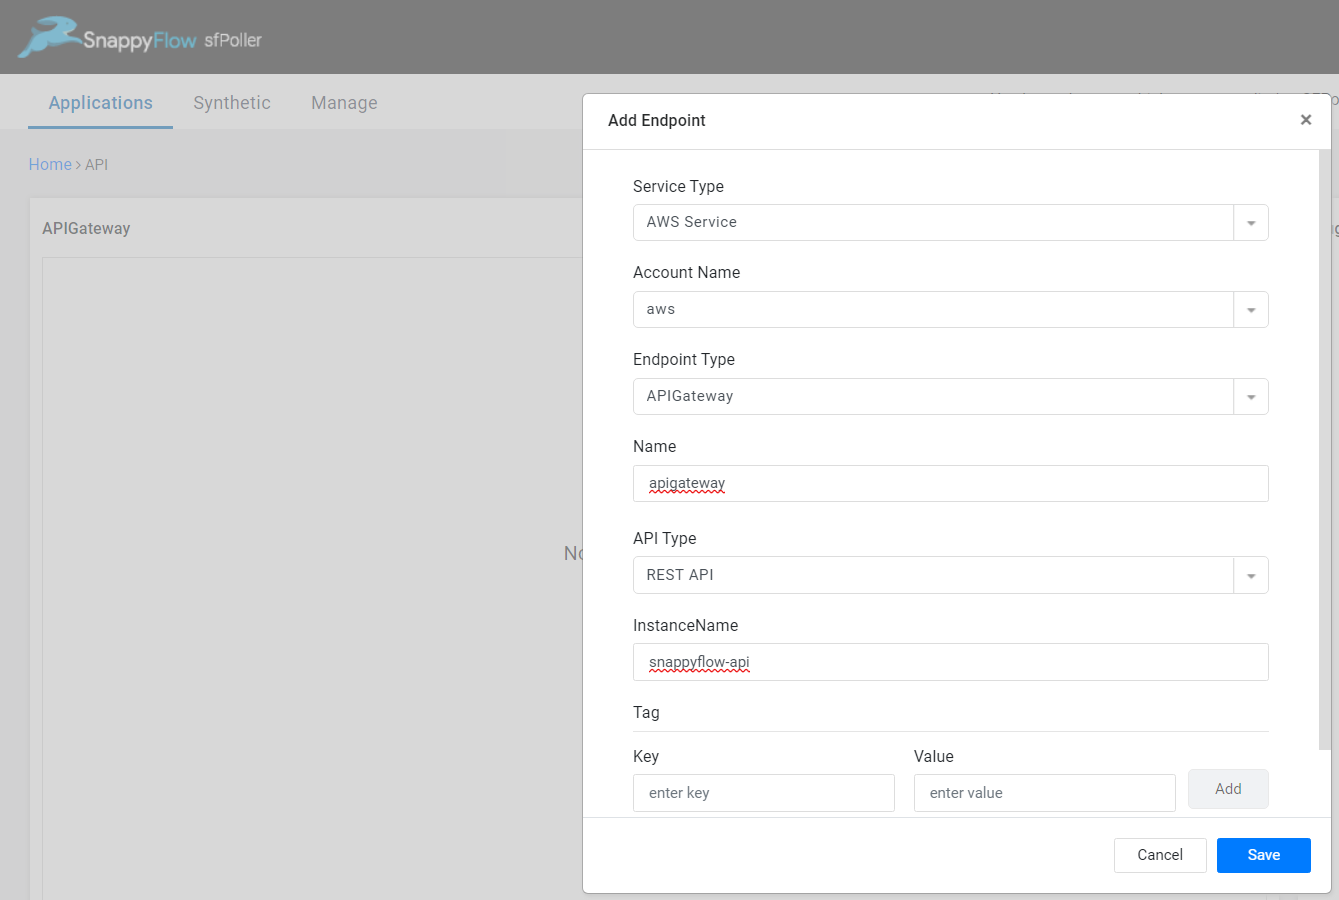
In the Endpoint page, select the
Add Endpointbutton, add the following data, and save.- Service Type: Select
AWS Service - Account Name:
aws - Endpoint Type:
APIGateway - Name: Give a meaningful name to the endpoint
- API Type: Select an API type (REST, HTTP, WebSocket)
- Instance Name: Give the API ID as instance name
- Service Type: Select
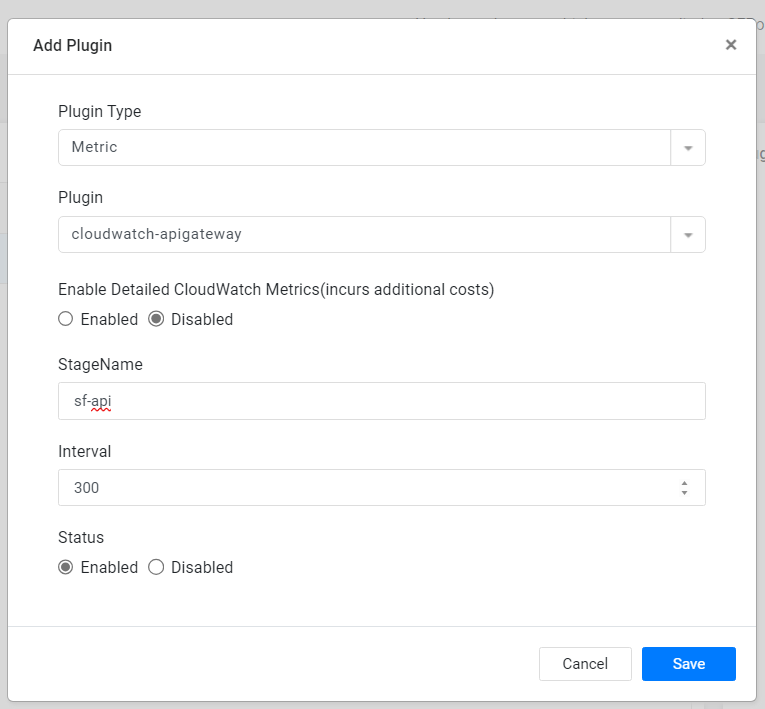
In the Plugins window, select the
+Addbutton.In the Add Plugin window, select the below details and save.
- Plugin Type:
Metric - Plugin:
cloudwatch-apigateway - Enable Detailed CloudWatch Metrics (incurs additional costs): By default, the status is
Disabled, enable if required - Stage Name: Give a stage name
- Plugin Type:
Monitor stage-specific metrics by specifying the desired stage name. If a stage name is not necessary, you can leave it empty. In case you forget to provide a stage name or left it empty intentionally, you will receive basic API metrics. For monitoring multiple stages, simply input the stage names separated by comma. To monitor all stages of a particular API, enter "all" as the input.
Interval: Choose an interval value. The minimum value for the interval is 300
Status: By default, the status is
Enabled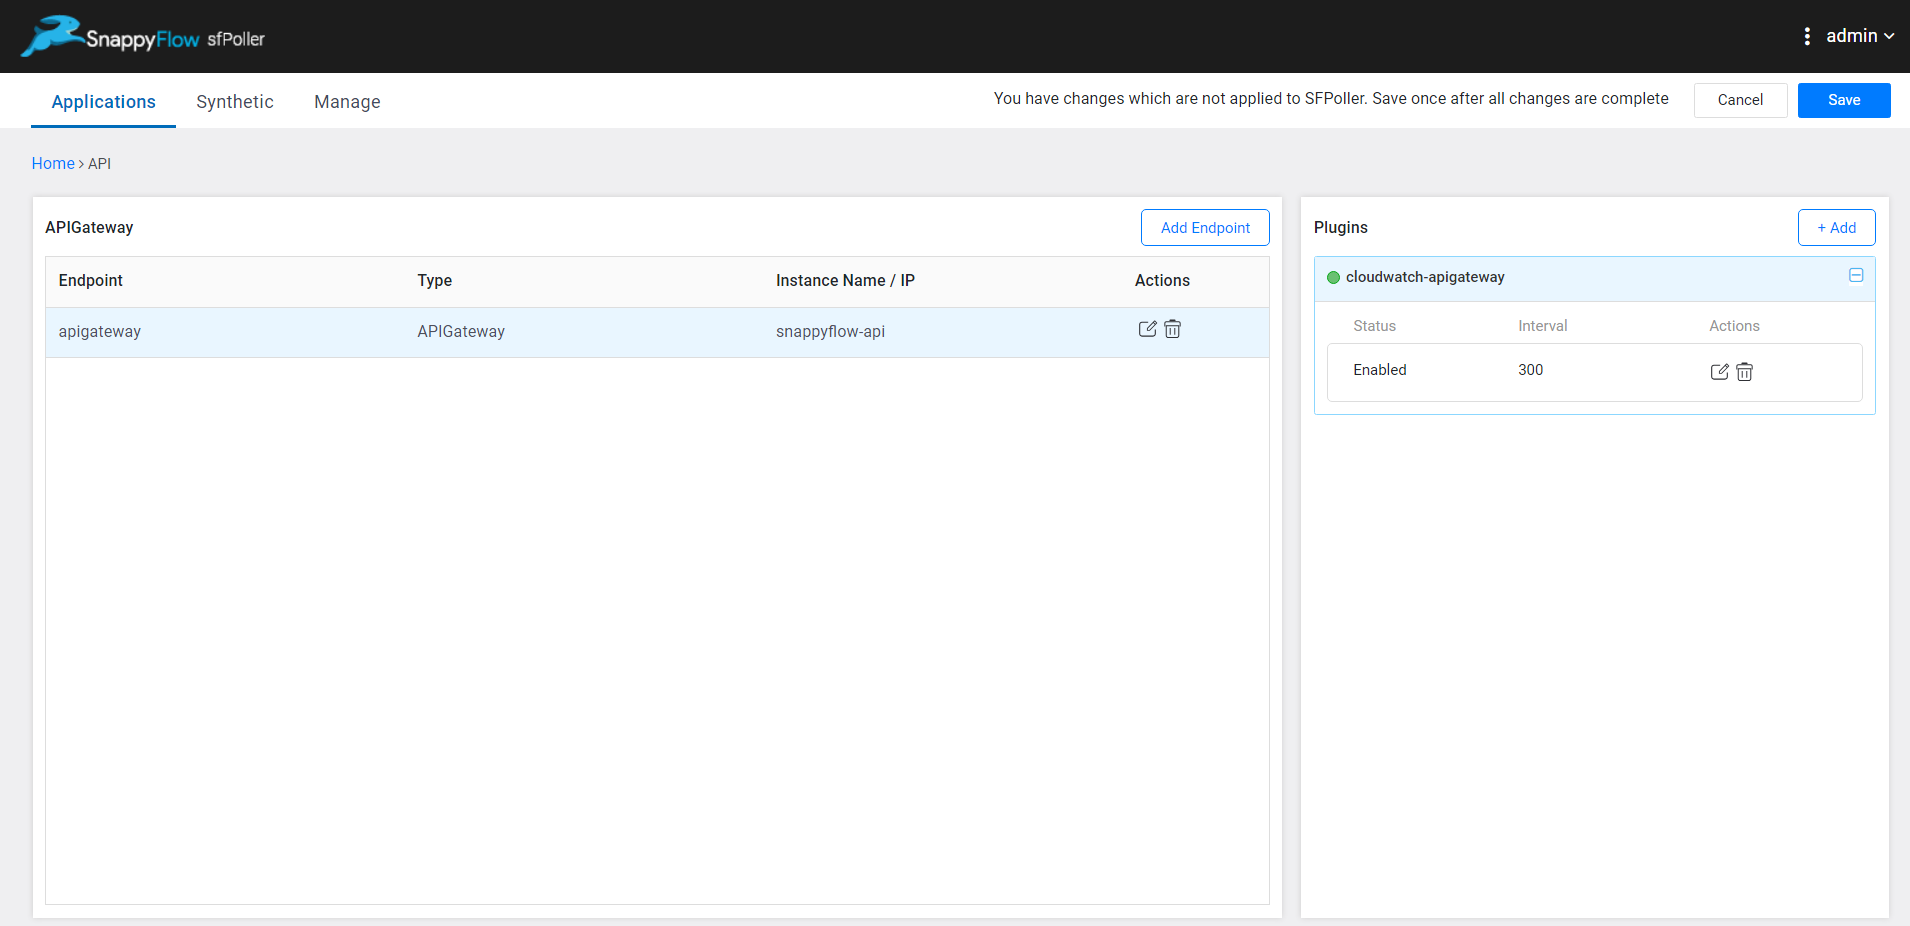
- Click the global
Savebutton in the window's top right corner to save all the changes made so far.
Additional Metrics
To view additional metrics follow the below steps:
- Firstly, enable additional metrics in AWS. Then call the stage:update action of the Amazon API Gateway - REST API and update the metricsEnabled property to true. Click here to learn about how to call Update Stage function.
- While adding the
cloudwatch-apigatewayplugin enable the Enable Detailed CloudWatch Metrics option.
View API Gateway Metrics
Follow the below steps to view the metrics collected from AWS APIGateway.
Go to the Application tab in SnappyFlow and navigate to your Project > Application > Dashboard.
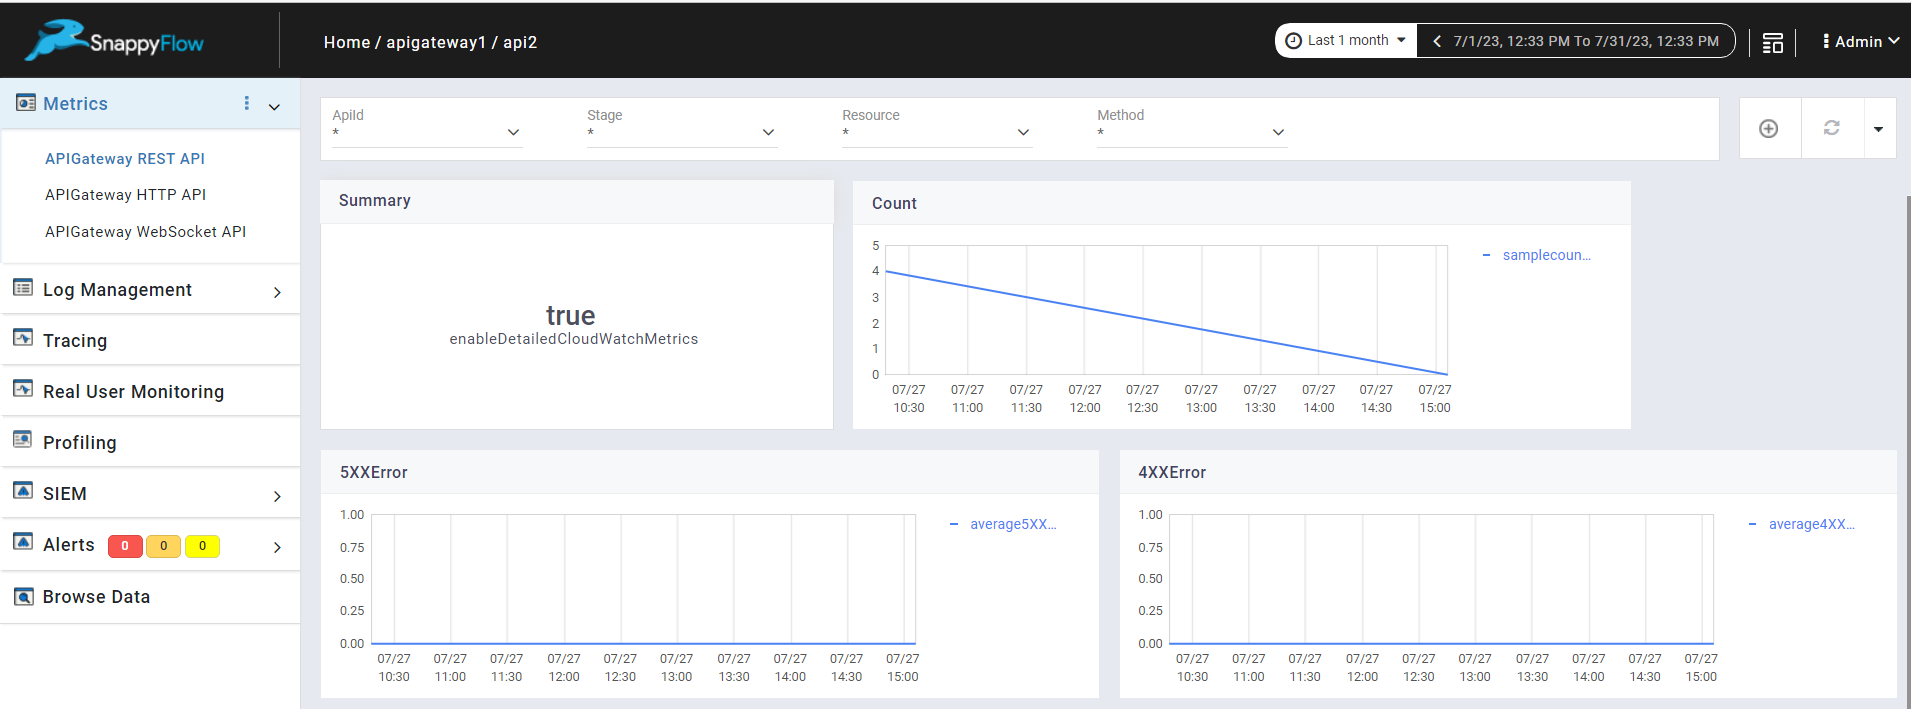
You can view the APIGateway metrics in the Metrics section.
Once plugin is added to sfPoller, they will be automatically detected within the Metrics section. However, if the plugins are not detected, you can import template to view the corresponding metrics.
- To access the unprocessed data gathered from the plugins, navigate to the Browse data section and choose the
Index: Metric,Instance: Endpoint,Plugin,andDocument Type.
Template Details
| Template | Plugin | Document Type | Description |
|---|---|---|---|
| APIGateway | cloudwatch-apigateway | apigatewayHttpApistats, apigatewayRestApiStats, apigatewayWebSocketApiStats | Collects metrics from APIGateway for a diverse range of API types, including HTTP API, REST API, and WebSocket API. |
Metric List
REST API and HTTP API
| Metric | Description |
|---|---|
| 4XXError | The number of errors captured from the client side. |
| Count | The number of calls to an API method. |
| 5XXError | The number of errors captured from the server side. |
| CacheHitCount | The number of requests served from the API cache. |
| CacheMissCount | The number of requests served from the back end when API caching is enabled. |
| average IntegrationLatency | The duration from a request sent from API Gateway to the back end and response received by APIGateway from the back end. The time is calculated milliseconds. |
| average Latency | The duration from a request sent from API Gateway to the back end and response received by APIGateway from the back end. The time is calculated milliseconds. The latency includes the integration latency and other API Gateway overhead. |
| Dataprocessed | The amount of data processed in bytes. |
WebSocket API
| Metric | Description |
|---|---|
| ConnectCount | The number of messages sent to the connect route integration. |
| MessageCount | The number of messages sent to the WebSocket API, either from or to the client. |
| IntegrationError | The number of requests that return 5XX response from the integration. |
| ClientError | The number of requests that have a 4XX response returned by API Gateway before the integration is invoked. |
| ExecutionError | Errors that occurred when calling the integration. |