Monitor HCP Consul
Overview
HCP (Hashicorp Cloud Platform) Consul is a service mesh and service discovery solution provided by Hashicorp. It enables platform operators to quickly deploy a fully managed, secure-by-default service mesh, helping developers discover and securely connect any application on any runtime, including Kubernetes, Nomad, and Amazon ECS.
SnappyFlow supports monitoring of HCP Consul and Envoy metrics through StatsD plugin. The StatsD plugin aggregates all the metrics exposed by HCP Consul and pushes them to SnappyFlow for data visualization and alerting. SnappyFlow provides a built-in dashboard template and a default StatsD rule file, customized to HCP Consul and Envoy metrics to get started easily.
Pre-Requisites
- Install sfAgent on target machine
- Since StatsD plugin is used, a custom rules file is required for Monitoring HCP Consul. Default rule files are available at
/opt/sfagent/statsd_rules/folder.
Configuring StatsD plugin
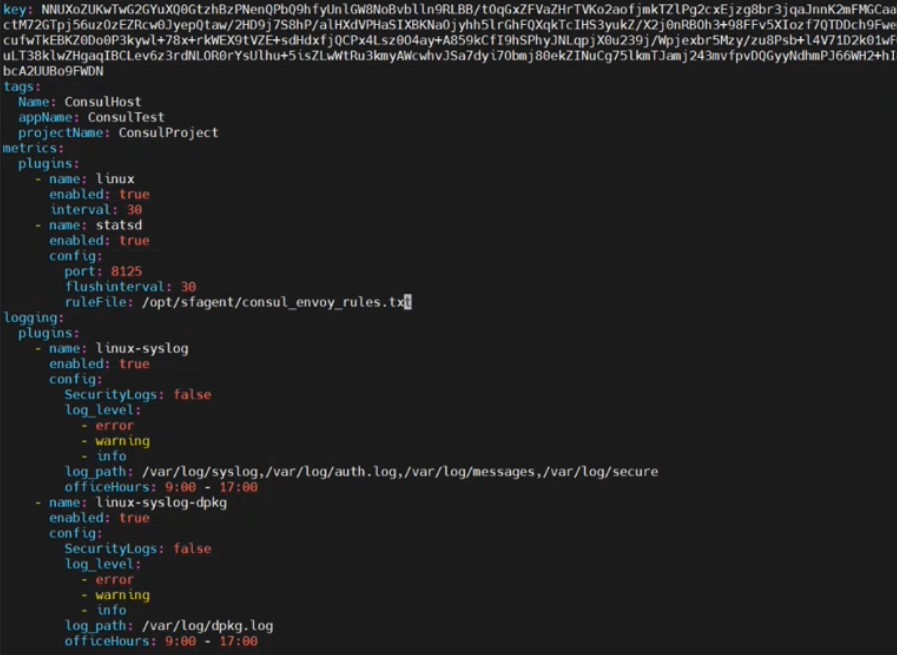
The config.yaml file under /opt/sfagent/ contains all configuration information for sfAgent. Edit this config file and add profile key, tags (Hostnames, Application Names, Project Names), and the StatsD plugin configuration details under metrics as provided in the code block below. Default rules files are provided under /opt/sfagent/statsd_rules/. In the config.yaml file, you may find other plugins pre populated by sfAgent.
To monitor envoy metrics use
/opt/sfagent/statsd_rules/envoy_rules.txt
To monitor consul metrics use
/opt/sfagent/statsd_rules/consul_rules.txt
To monitor consul and envoy metric use
opt/sfagent/statsd_rules/consul_envoy_rules.txt
key: <input_profile_key_from_snappyflow_account>
tags:
  Name: <provide_host_name>
  appName: <provide_application_name>
  projectName: <provide_project_name>
metrics:
  plugins:
    - name: statsd
      enabled: true
      config:
        port: 8125
        flushinterval: 30
        ruleFile: <path_to_rule_file>
key: Enter the profile key from SnappyFLow account
tags: Provide necessary tags
port: The UDP port on which statsd client sends metrics. sfAgent runs a statsd server listening on this port for the UDP datagrams. Default value is 8125
flushInterval: SnappyFlow’s statsd plugin collects all the metrics received in the last N seconds and sends the data to SnappyFlow as a single document
ruleFile: Provide the path to the statsd rules file. Please contact support@snappyflow.io to create a rule file for a custom statsd client
The StatsD configuration and rules files need to be validated for any changes to rules files to take effect. Post validation, sfAgent needs to be restarted.
To validate StatsD configuration, run
sudo /opt/sfagent/sfagent -check-statsd
To restart sfAgent, run
service sfagent restart
A typical config file with pre-popluated linux plugins
Verifying plugin operation
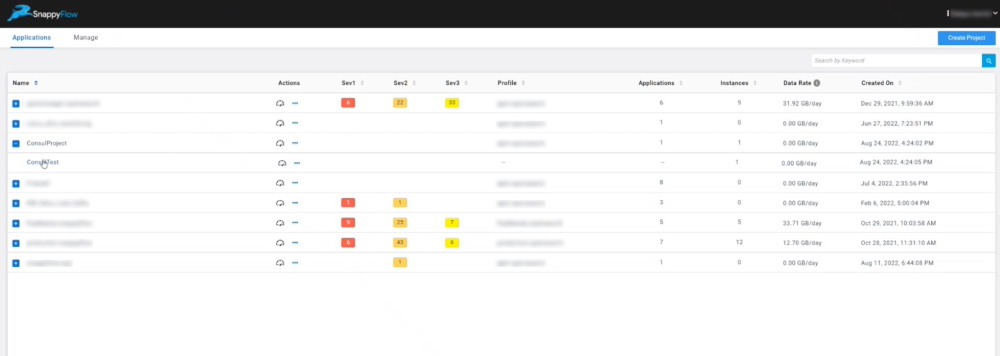
Once the StatsD plugin is configured, rule files validated and sfAgent restarted, you should now see the newly created Consul Application and Project under the names as defined in the config.yaml file.
Tagged and discovered endpoints are automatically added to SnappyFlow
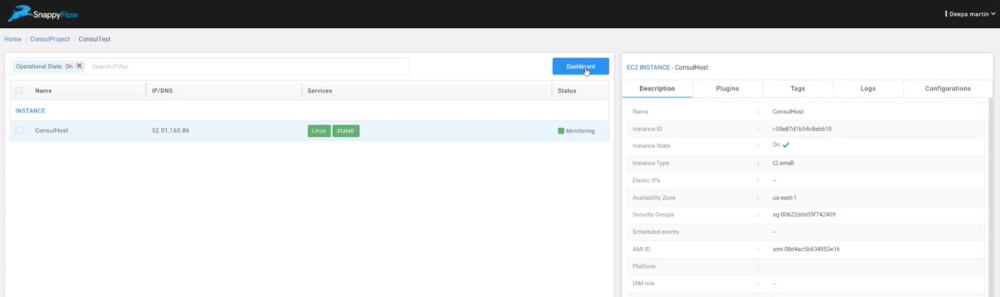
Clicking on the project takes you to the inventory page which gives a list of endpoints and services running under that project name.
Verifying that StatsD plugin is running
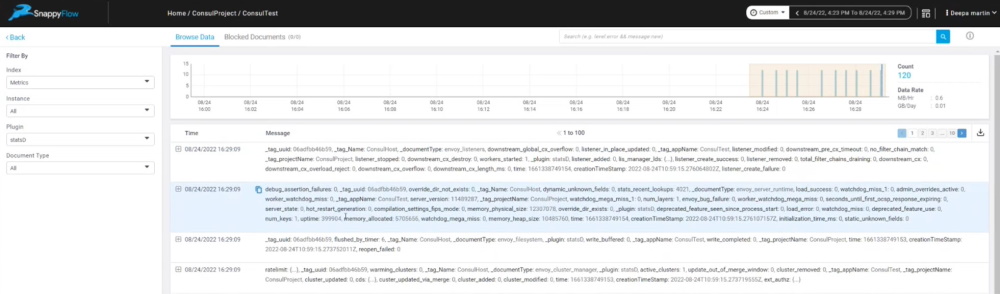
Another way to check if SnappyFlow is receiving metrics is to check the Browse Data tab. Filter by StatsD plugin to see all raw data coming into SnappyFlow.
Checking for raw data
Setting up dashboards
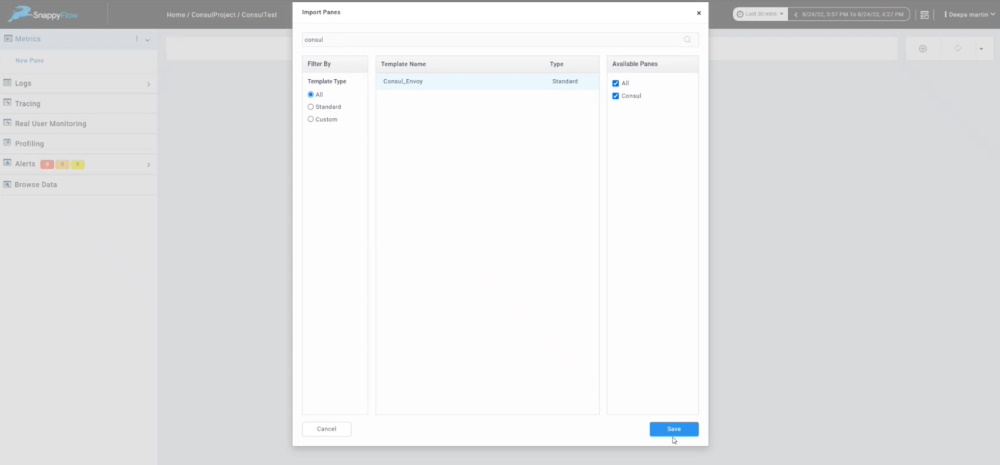
SnappyFlow provides a built in dashboard template for Consul and Envoy metrics. To setup dashboards, go to the project and under metrics, click on the 3 dots menu and select Import from Template option. Search for consul and clone and save the template to your dashboard.
Importing built-in dashboards
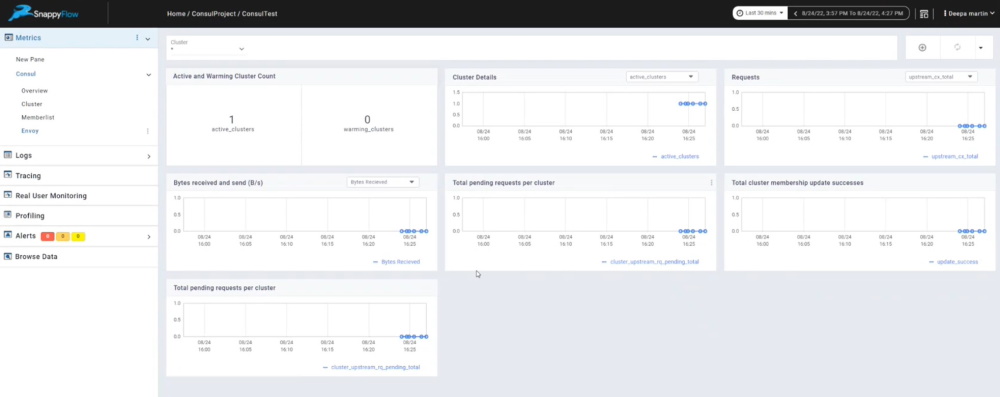
HCP Envoy dashboard
For help with plugins, please reach out to support@snappyflow.io.