Monitor AWS CloudFront
Overview
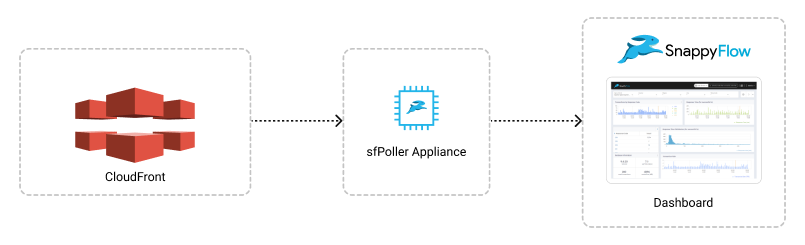
The CloudFront Plugin of SnappyFlow collects CloudFront metrics from CloudWatch and visualize them through SnappyFlow dashboard. This integration is designed to give you comprehensive insights into both CloudFront distribution and CloudFront functions.
Prerequisite
To collect metrics from CloudWatch, it is necessary to have an IAM Role with CloudWatch access and sfPoller set up within your AWS environment. Click here to learn more about setting up sfPoller in your AWS environment.
Create a Policy to Access CloudWatch
Sign in to the AWS Management Console and open the IAM console at https://console.aws.amazon.com/iam/.
Follow the below steps to create a policy in the IAM console.
Navigate to Access Management > Policies
In the Create policy window, go to the JSON tab
Copy and paste the below-mentioned JSON code into the policy editor
 {
  "Version": "2012-10-17",
  "Statement": [
      {
        "Sid": "VisualEditor0",
        "Effect": "Allow",
        "Action": [
                   "cloudfront:GetMetricData",
                   "cloudfront:Get*",
                   "cloudfront:DescribeFunction",
                   "cloudfront:List*" ,
                   ],
        },
    ],
}
Click the
Next: Tags>Next: ReviewbuttonIn the Review policy window, give the Name:
CloudWatchReadOnlyAccessand Description (Optional) for the policy and review the list of permissionsClick the
Create policybuttonAttach the
CloudWatchReadOnlyAccesspolicy to a dedicated IAM Role for read-only access
Configure sfPoller to Collect Metrics
Follow the below step to add endpoints and plugins in sfPoller.
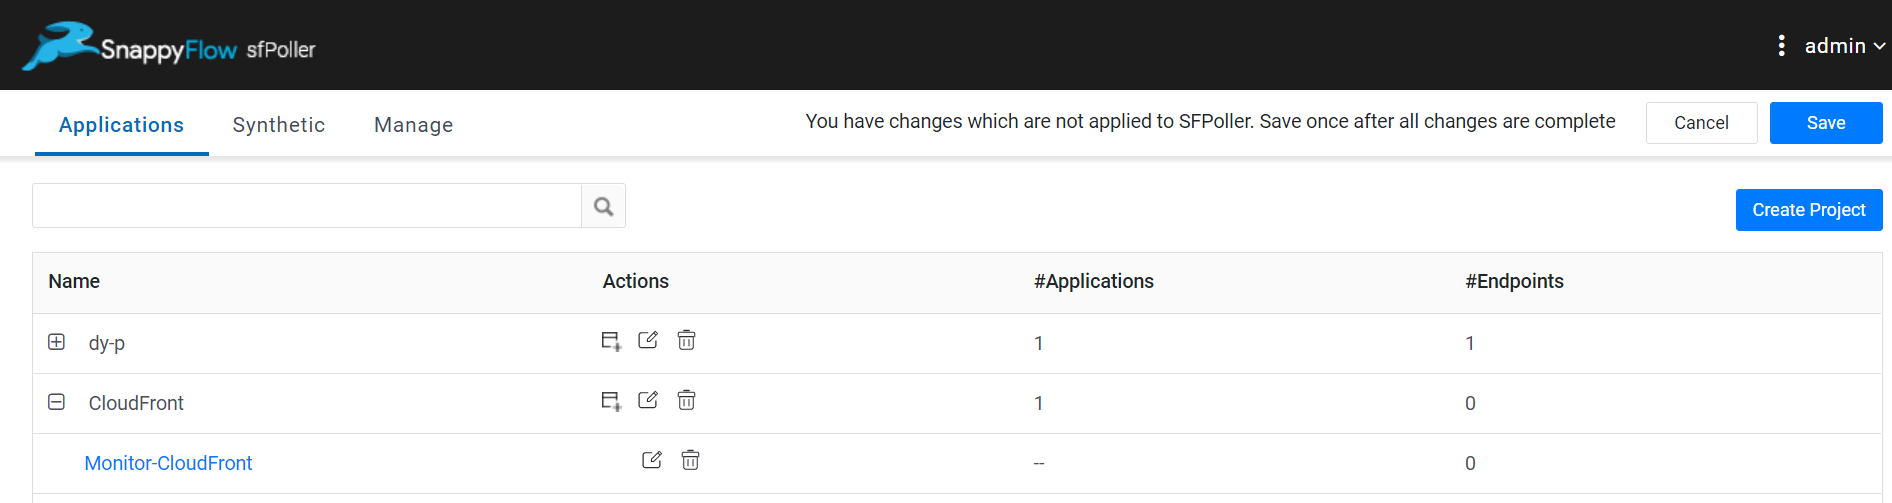
Go to the Application tab of sfPoller, navigate to your Project > Application.
Select the Application, it will take you to the
Endpointpage.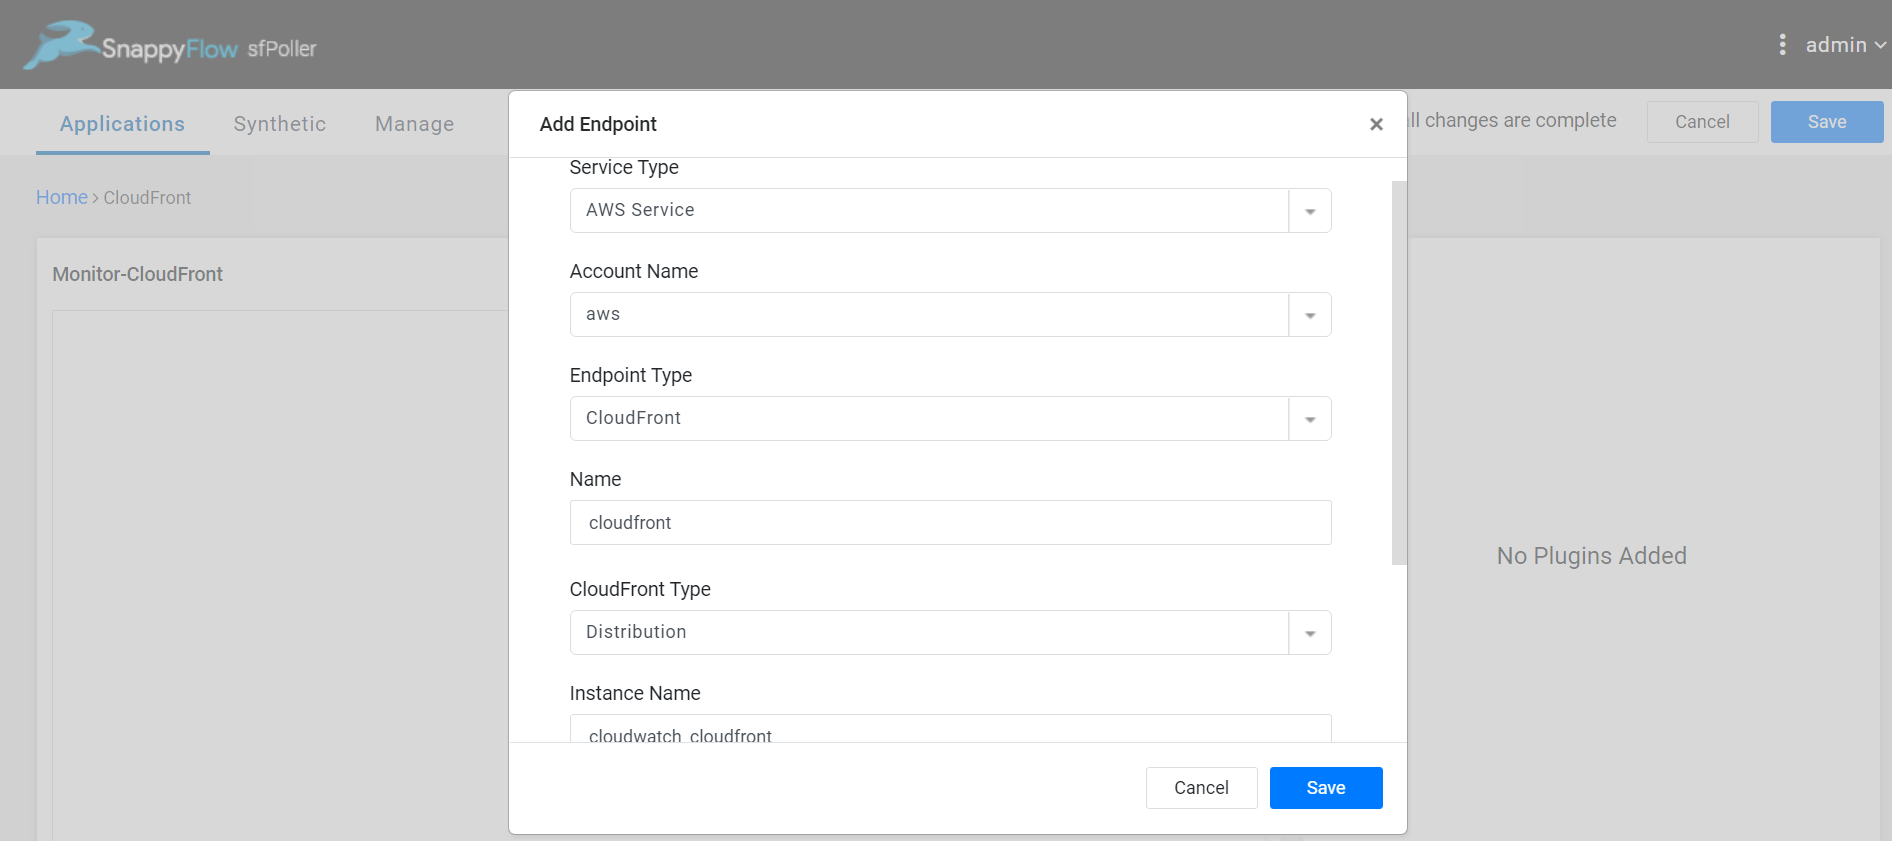
In the Endpoint page, select the
Add Endpointbutton, add the following data, and save.- Service Type: Select
AWS Service - Account Name:
aws - Endpoint Type:
CloudFront - Name: Give a meaningful name to the endpoint
- CloudFront Type: Select a CloudFront type (Distribution or Function)
- Instance Name: Give your instance name
- Service Type: Select
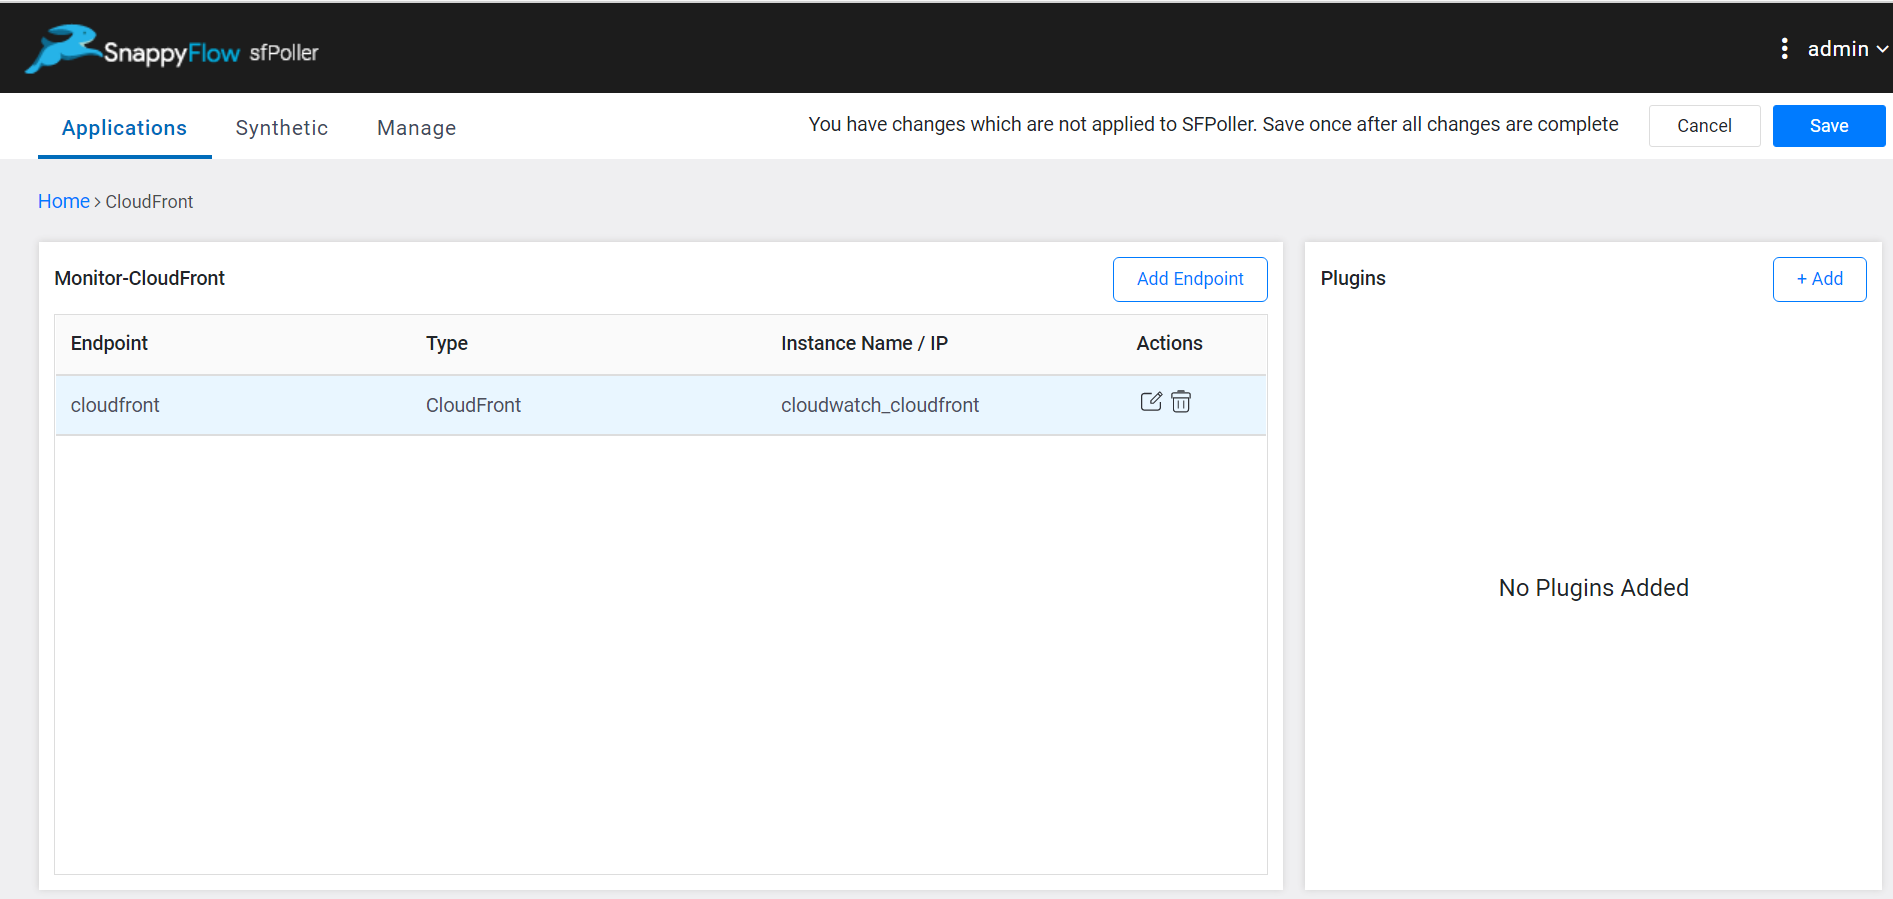
In the Plugins window, select the
+Addbutton.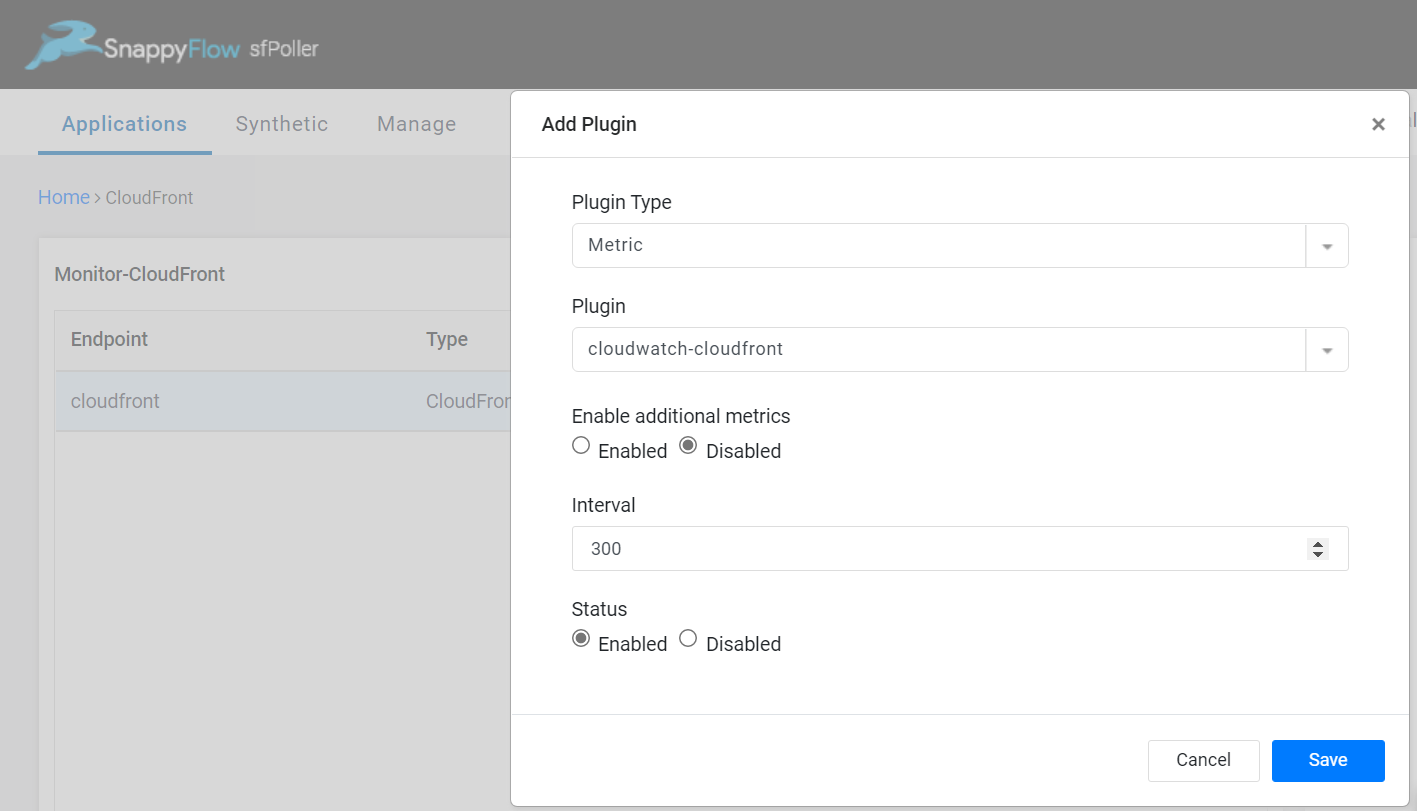
In the Add Plugin window, select the below details and save.
Plugin Type:
MetricPlugin:
cloudwatch-cloudfrontEnable additional metrics: By default, the status is
Disabled. Enable if required.Interval: Choose an interval value. The minimum value for the interval is 300
Status: By default, the status is
Enabled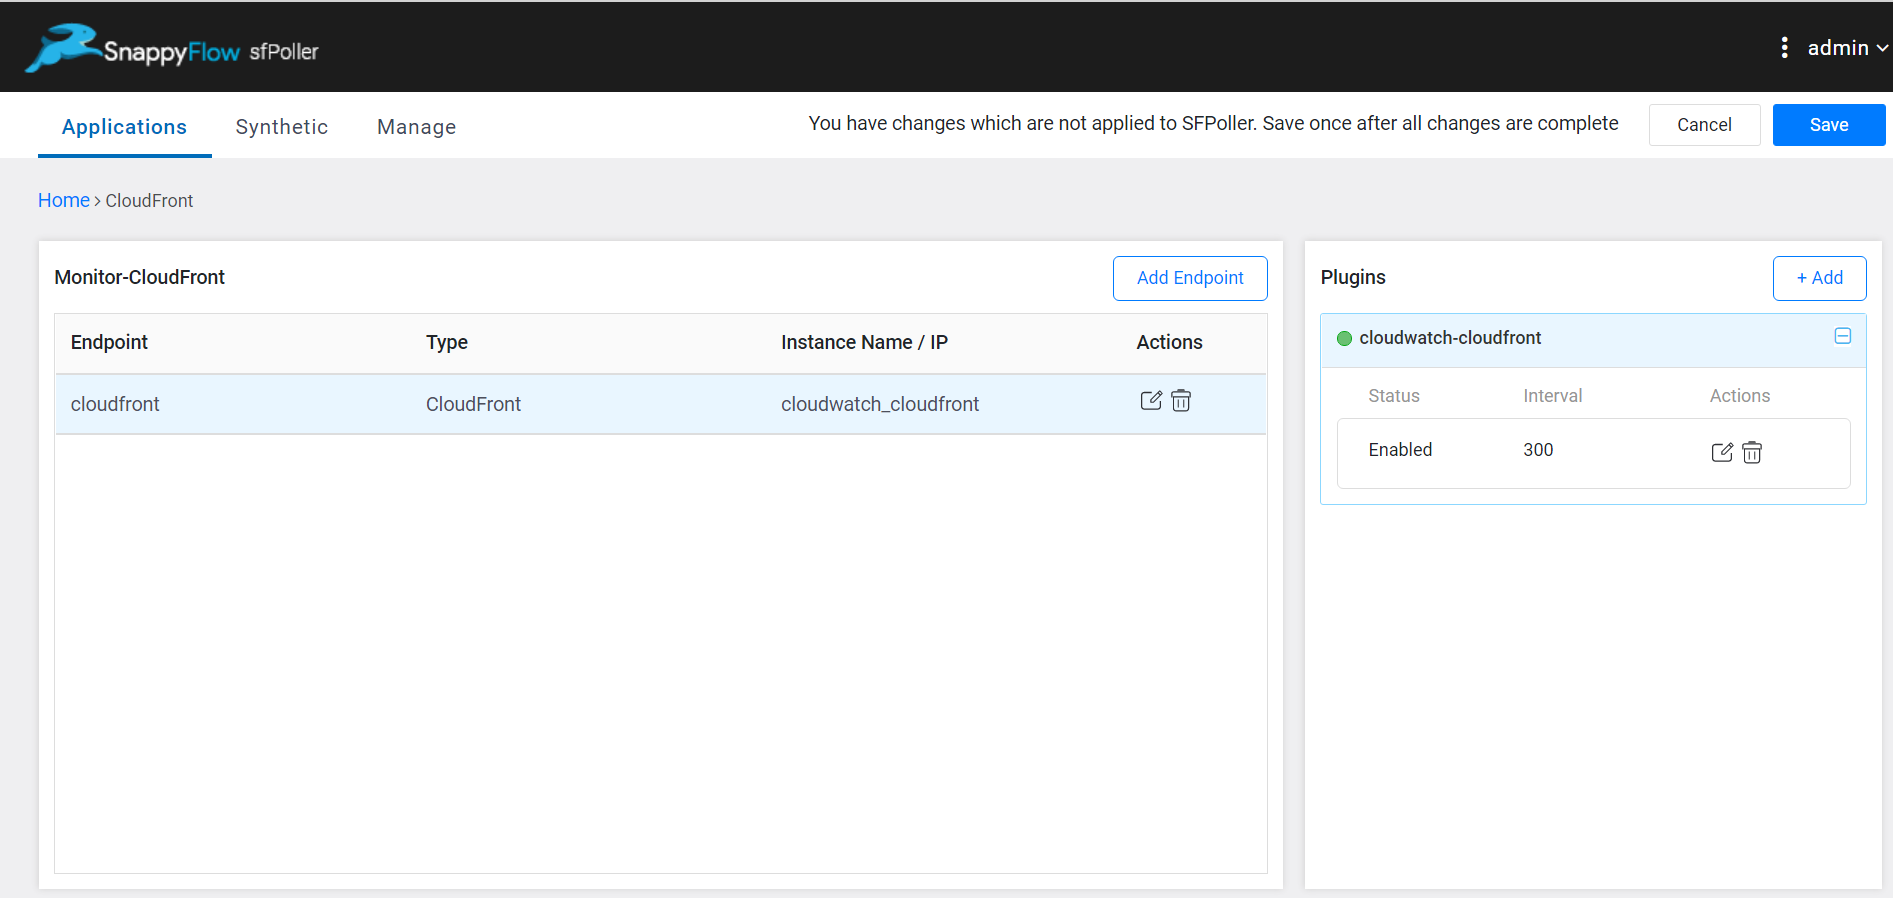
- Select the global
Savebutton in the window's top right corner to save all the changes made so far.
Additional Metrics
To view additional metrics follow the below steps:
- Enable the additional metrics in your AWS environment. Click here to learn how to enable additional metrics in AWS.
- While adding the
cloudwatch-cloudfrontplugin enable the Enable additional metrics option.
View CloudFront Metrics
Follow the below steps to view metrics collected by CloudFront plugin.
Go to the Application tab in SnappyFlow and navigate to your Project > Application > Dashboard.
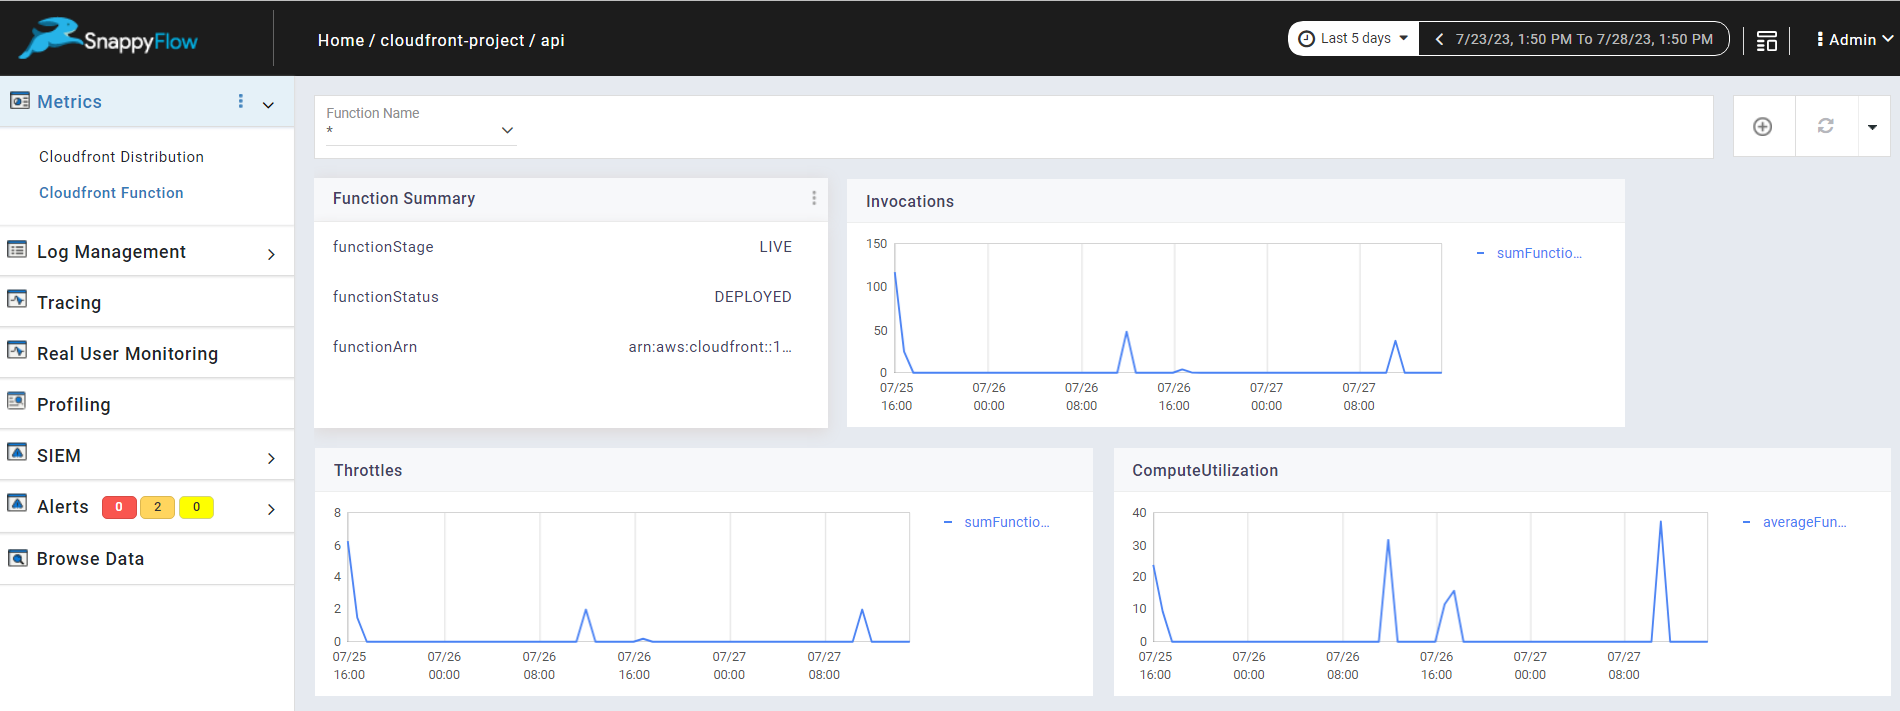
- You can view the CloudFront metrics in the Metrics section.
Once plugin is added to sfPoller, they will be automatically detected within the Metrics section. However, if the plugins are not detected, you can import template to view the corresponding metrics.
- To access the unprocessed data gathered from the plugins, navigate to the Browse data section and choose the
Index: Metric,Instance: Endpoint,Plugin,andDocument Type.
Template Details
| Template | Plugin | Document Type | Description |
|---|---|---|---|
| CloudFront | cloudwatch-cloudfront | Cloudfront Distribution, Cloudfront Function | Collects metrics from cloudfront per distribution or function. |
Metric List
Distribution Metrics
| Metric | Description |
|---|---|
| 4xxErrorRate | The percentage of all viewer requests for which the response of the HTTP status code is 4xx. |
| 5xxErrorRate | The percentage of all viewer requests for which the response of the HTTP status code is 5xx. |
| BytesDownloaded | The total number of bytes downloaded by viewers for GET, HEAD, and OPTIONS requests. |
| BytesUploaded | The total number of bytes uploaded by the viewers to your origin with CloudFront, using POST and PUT requests. |
| Requests | The total number of viewer requests received by CloudFront, for all HTTP methods and for both HTTP and HTTPS requests. |
| TotalErrorRate | The percentage of all viewer requests for which the response of the HTTP status code is 4xx or 5xx. |
Additional Distribution Metrics
| Metric | Description |
|---|---|
| cacheHitRate | The percentage of all cacheable requests for which CloudFront served the content from its cache. Errors and HTTP requests such as POST and PUT requests are not considered as cacheable requests. |
| 503ErrorRate | The percentage of all viewer requests for which the response of the HTTP status code is 503. |
| 504ErrorRate | The percentage of all viewer requests for which the response of the HTTP status code is 504. |
| 401ErrorRate | The percentage of all viewer requests for which the response of the HTTP status code is 401. |
| 404ErrorRate | The percentage of all viewer requests for which the response of the HTTP status code is 404. |
| 502ErrorRate | The percentage of all viewer requests for which the response of the HTTP status code is 502. |
| OriginLatency | The total time spent from when CloudFront receives a request to when it starts providing a response to the network (not the viewer), for requests that are served from the origin, not the CloudFront cache. |
Function Metrics
| Metric | Description |
|---|---|
| FunctionInvocations | The number of times the function was started (invoked) in a given time period. |
| FunctionValidationErrors | The number of validation errors produced by the function in a given time period. |
| FunctionExecutionErrors | The number of execution errors that occurred in a given time period. Execution errors occur when the function fails to complete successfully. |
| FunctionComputeUtilization | The amount of time that the function took to run as a percentage of the maximum allowed time. |
| FunctionThrottles | The number of times that the function was throttled in a given time period. |