Monitor Elastic Load Balancer
Overview
Amazon Elastic Load Balancer(ELB) is used to automatically distribute incoming app traffic across AWS Instances which may be in different availability zones. ELB monitoring will collect all metrics provided by AWS for all three load balancer types i.e Classic, Network and Application Load Balancer.
Prerequisites
CloudWatch Access for IAM Role
Provide Read only access for CloudWatch to the dedicated IAM Role used for APM. You can use AWS managed polices that addresses many common use cases by providing standalone IAM policies that are created and administered by AWS. Attach this AWS policy CloudWatchReadOnlyAccess to IAM role to get read access for all CloudWatch else create the below custom policy and attach it to IAM.
     {
      "Version": "2012-10-17",
      "Statement": [
        {
          "Action": [
            "cloudwatch:Describe*",
            "cloudwatch:Get*",
            "cloudwatch:List*",
            "logs:Get*",
            "elasticloadbalancing:Describe*"
          ],
          "Effect": "Allow",
          "Resource": "*"
        }
      ]
    }
Health check interval should be less than 300 Secs, since querying for data is 5mins interval it might report incorrect data from AWS.
sfPoller Configuration
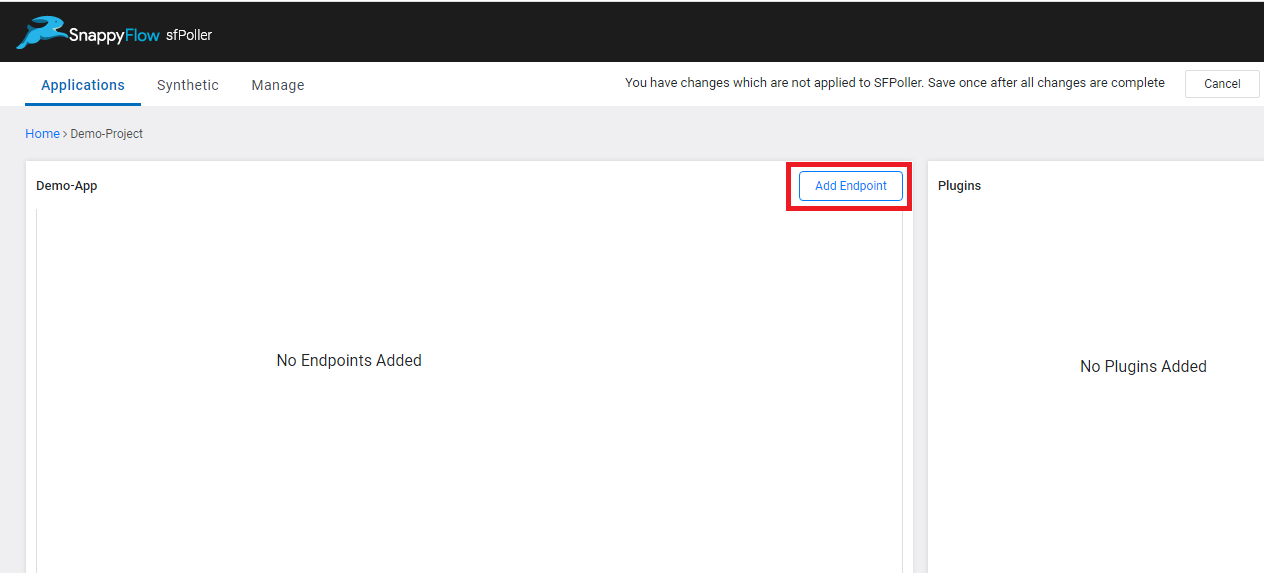
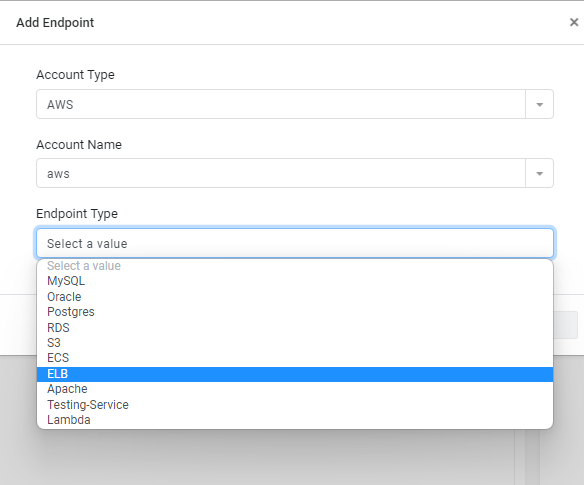
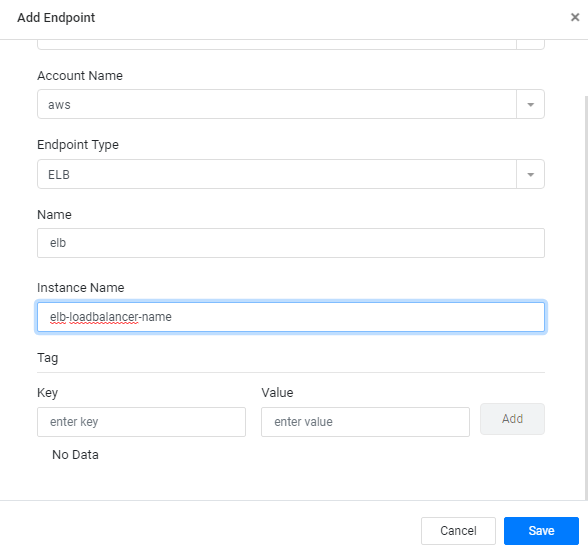
Select ELB Endpoint Type in Add Endpoints and add the load balancer name:
- Add Endpoint

- Select ELB Endpoint

- Enter the loadbalancer name

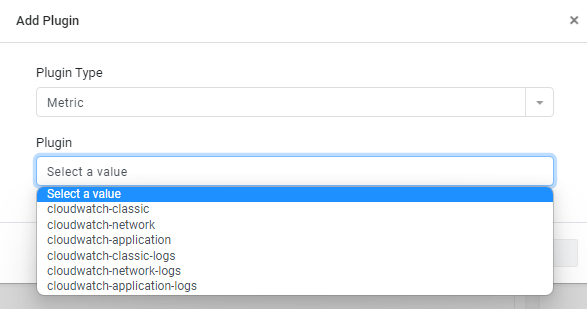
Select the plugin from the dropdown under Plugins tab and config the polling interval. Plugin configuration for ELB services this includes Classic, Network and Application plugin. You can enable/disable any of the plugin based on your needs and instance support.
- Cloudwatch-classic - Collects data for classic load balancer
- Cloudwatch-network - collects data for Network load balancers
- Cloudwatch-application - collects data for Application load balancers.
Add the appropriate plugins

View Data and Dashboards
All CloudWatch metrics are collected and tagged based on their ELB type to get displayed in their respective dashboard template. Use ELB_Network, ELB_Application and ELB_Classic for data visualization as per the ELB.