Getting Started
Alerts in SnappyFlow
Defining the scope of alerts
Key Concepts
To use SnappyFlow alerts well, it will help you to understand the terms we use:
| Alert Terms | Comment |
|---|---|
| Alert Metric | A monitored data source like CPU utilization or RAM utilization. |
| Condition | An alert condition includes a) a monitored metric and b) a thresholds that define the behavior that is considered a violation. For instance, an NGINX alert condition could be defined as response time for an http request exceeding the 95th percentile of all response times. |
| Threshold | When you create a condition, there is a required critical-level threshold. In the above example 95th percentile is the threshold. |
| Violation | A violation occurs when the value of a data source crosses an alert condition’s threshold. This leads to the creation of a violation event. A violation does not automatically create a notification. Alerts history lists all the violations, with the most recent ones at the top. |
| Notification | At the alert policy level, you choose if a violation needs to be notified. SnappyFlow offers several notification channels such as email, Slack and webhooks. You can also include charts about the violation to provide context and share them with your team. |
Basic Terminology
Primary metric
This is the metric on which alerts are defined. Primary Metric is sampled at the defined “periodicity” and for the duration of “sampling period”. Users can define Primary Metric in following ways:
Single real number variable: E.g.
CPUUtilcalculates average of the variable over the sampling periodExpression: E.g.
DiskUtil= usage*100/capacitycalculates the expression using average values of the variables in the expressionAggregations: All variables implicitly use average aggregation. However, users can explicitly a specific aggregation using suffixes such as .min, .max, .sum, .count, .95P, .term(last value)
Periodicity
Periodicity at which the alert is fired. It can be defined as 5m (5 minutes) or 1h (1 hour) or 1d (1 day).
Sampling Period
Sampling window in which primary metric is evaluated. It can be defined as 5m (5 minutes) or 1h (1 hour) or 1d (1 day).
Secondary metric
Users can choose to collect additional metrics along with the primary metric. Users can add secondary metrics to alert text to provide additional diagnostics. For example, it is useful to accompany disk latency metric with read/write IOPS and throughput. Secondary Metric is also very useful to define multi-variable alert conditions.
Alert Conditions
Defines alert conditions for severity (sev1/2/3) alerts. A condition compares present value(TH). Multiple ways to express thresholds are supported.
- Absolute value: E.g.
CPUUtil GT 90 - Time based thresholds: E.g.
TCPReset GT (1h,avg)which denotes “check if average of TCPReset calculated over the sampling period is GT average of TCPReset calculated over the last 1 hour preceding the sampling period”. Time period can be defined as Xm (e.g. 30m), Xh (e.g. 1h) or Xd(e.g. 2 d) - Time based threshold with limits: E.g.
TCPReset GT max(200,(1h,avg))which means enable the alert only when TCPReset > 200 - Past reference time: E.g.
Response_Time.95P > dod(1h,95P)compares the 95 th percentile of response time over the sampling period with the 95 th percentile of response time over a 1 hour period exactly one day back. Expressions supported aredodfor Day on Day,wowfor Week on Week andmomfor Month on Month
Constructing an Alert text
Creating a meaningful alert message is important for diagnostics. Users can create effective alerts using parameterization. For e.g.,
- “CPU utilization is high. PV=TH”. $PV is the current value of the primary metric and $TH is the defined alert threshold
- “Read latency is high. PV=TH,read_IOPS=$read_IOPS, Write_IOPS= $write_IOPS”. In this example,read_IOPS and write_IOPS are secondary metrics collected to provide additional context for analysis
Scope of an Alert
Alert can be executed in the following modes.
- Apply check to all instances: Enabling this option will cause the check to be operated on all the instances in the application. Condition
tag_Name == *is inserted in the where clause of the alert - Apply check for all values of custom tag: Enabling this option will cause the check to be operated on all unique values of the custom tag. E.g. If user wants to specify an alert to check the health of each index in Elasticsearch and raise a separate alert for each issue found, user will have to specify the condition
check index_health != green where index_name==*. In this example, the custom tag isindex_name - Apply check to a specific data point: This option is used when the check is very specific to a single data point e.g. check if
Cluster_status != Green. No automatic tags are inserted if this option is enabled
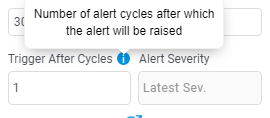
Trigger After Cycles
This allows users to add number of trigger cycles to wait before raising the alert, when the user adds trigger after cycles, alert will not raise and wait for the given trigger after cycles even though it satisfies any one of the severity conditions.
This option will avoid to raise an issue immediately after its occurrence. For a e.g., if user has created an alert to raise Sev1 alert if the count of error log is more than 1 for sampling period 5 mins and periodicity 5 mins.
Consider the situation when system was being upgraded now in the last 5 mins all the API calls failed and created lot of error but only in 1 alert cycle (i.e., the severity condition is satisfied in 1 alert cycle alone, this issue is not consistent).
As this change in system was momentary, the raising of alert immediately can be avoided by checking the consistency of the alert that can be done by enabling “Trigger after” specifying to wait 5 cycles before raising an alert (i.e., checking if last 5 alert cycles the severity condition (error count > 1) is satisfied and then raising Sev1 alert).
E.g. When user adds 3 cycles to be wait and for the first or second cycle alert satisfy any one severity condition it will not raise and for the third cycle if it satisfies any severity condition it will be raised.
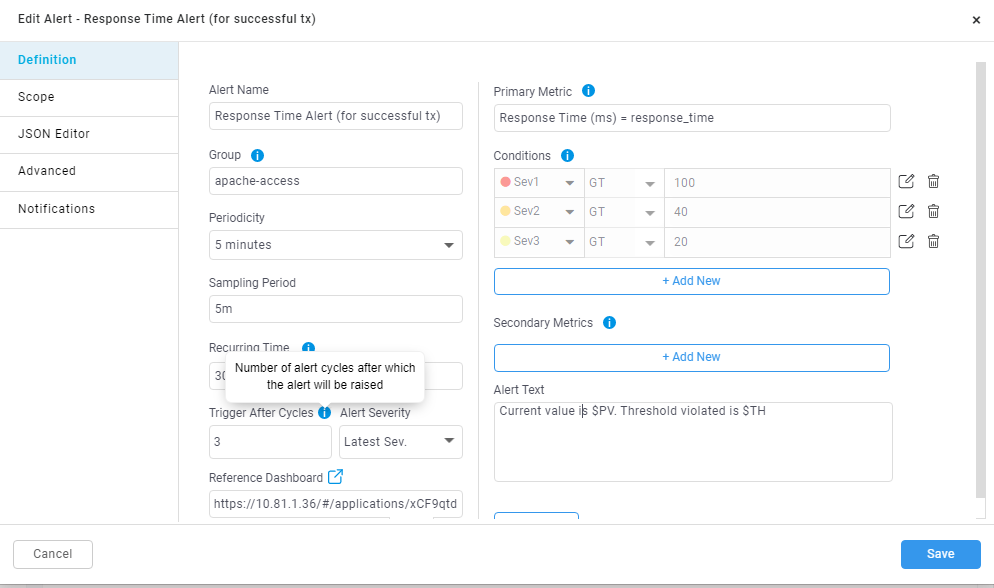
Consider the Avg Response Time alert with below details. Trigger After Cycles: 3 Severity conditions: Sev1: Avg Response Time > 60 Sev2: Avg Response Time > 25 Sev3: Avg Response Time > 10
For 1st cycle: If avg response time is 65.9 which is > 60 so satisfy sev1 condition but alert will be not raised.
For 2nd cycle: If avg response time is 50.5 which is > 25 so satisfy sev2 condition but alert will be not raised.
For 3rd cycle: If avg response time is 43.7 which is > 25 so satisfy sev2 condition and this time alert will be raised.
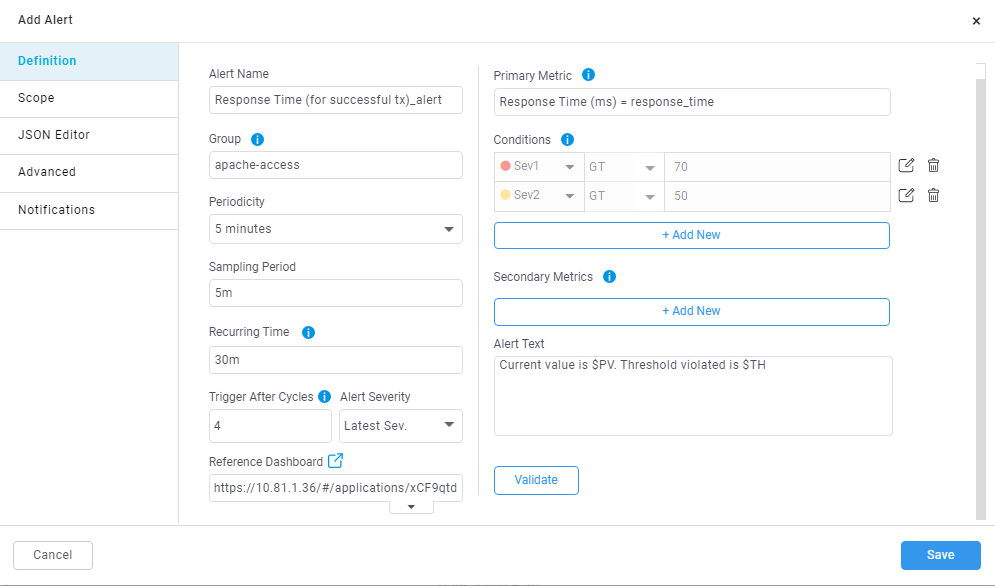
Trigger after cycles while adding or editing the alert:
As shown in the above image text box is provided to add ‘Trigger After Cycle’ also there is a drop down for Selecting Alert Severity that will be ‘Latest Sev’ or ‘Highest Sev’
Alert Severity: If the Trigger After Cycles is set at 4 for an alert, then below will be the alert behaviour before its triggered.
- For 1st cycle: Satisfies Sev2 but alert will be not raised.
- For 2nd cycle: Satisfies Sev2 but alert will be not raised.
- For 3rd cycle: Satisfies Sev3 but alert will be not raised.
- For 4th cycle: Alert will be raised.
If Alert severity is set as ‘Latest Sev’ then at 4th cycle Sev3 alert will be raised because the latest Sev3 condition is satisfied at 3rd cycle. If Alert severity is set as ‘Highest Sev’ then at 4th cycle Sev2 alert will be raised because in previous 3 cycles Sev2 condition is satisfied two times and its highest.
How to add trigger after cycles in alert.
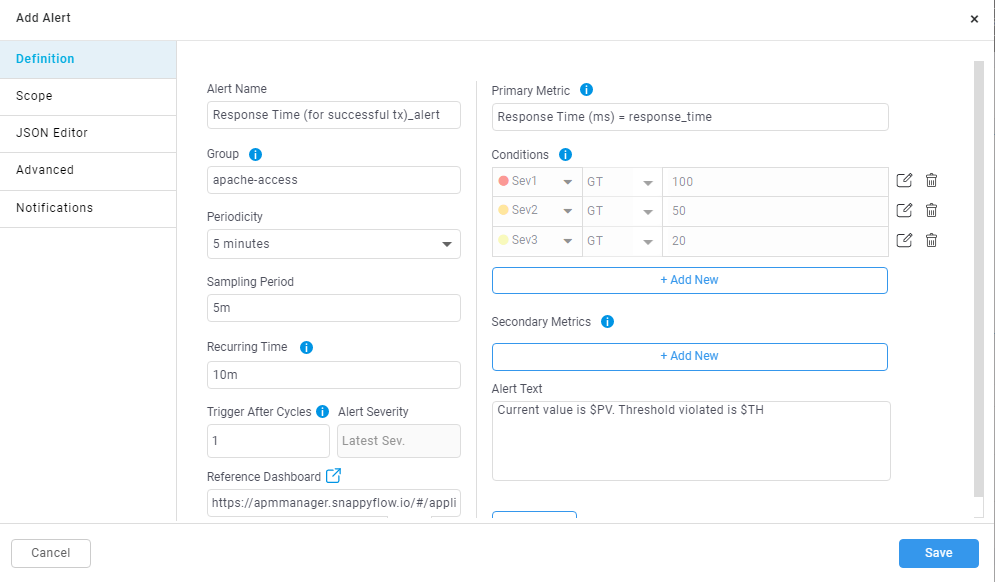
By default, ‘Trigger After Cycle’ will be always 1 and ‘Alert Severity’ will be ‘Latest Sev’ while adding the alert as shown in the below image.
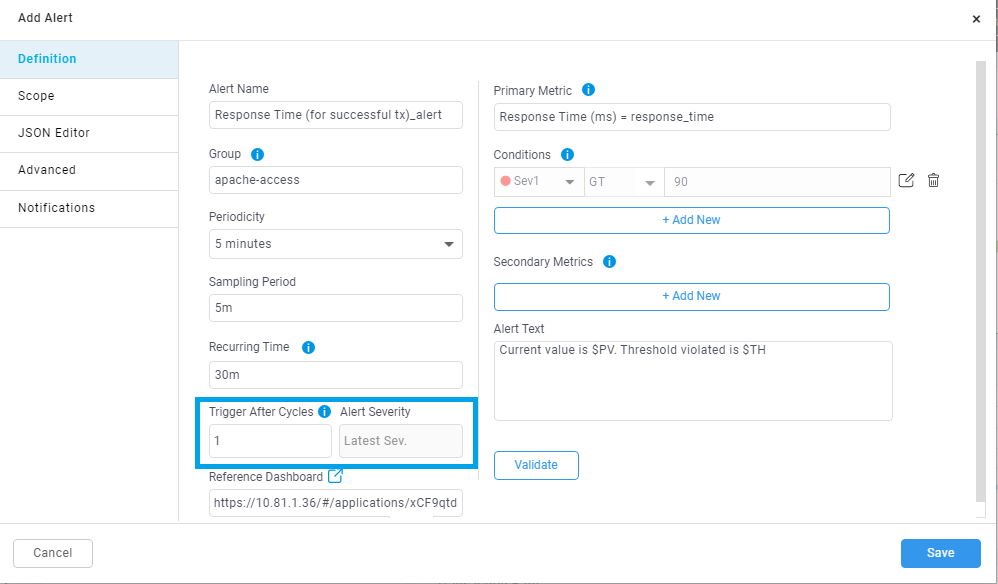
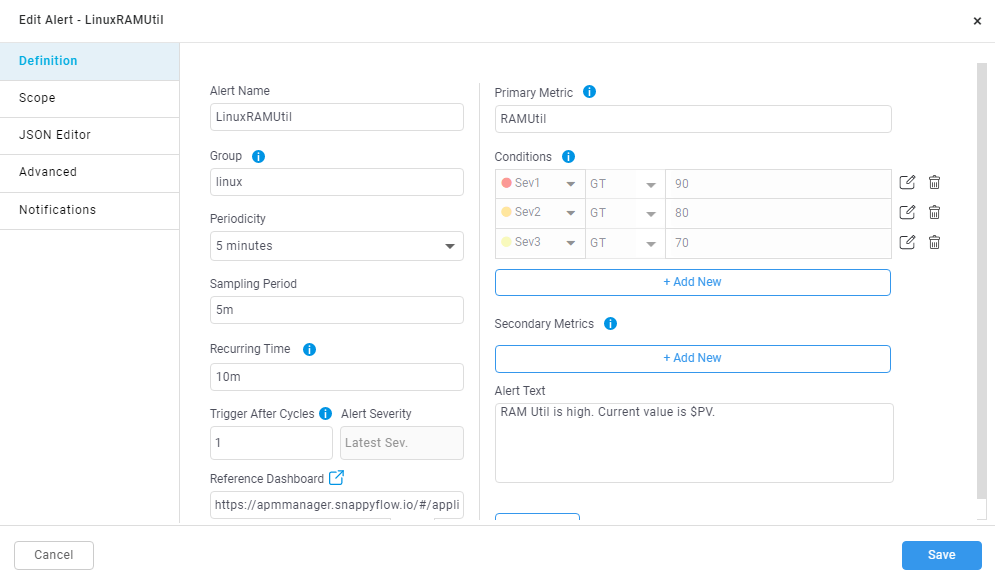
As shown in the below image while adding or editing the alert you can use text box provided as ‘Trigger After Cycle’ to add number of cycles to be wait by the alert before raising and you can also use dropdown to select ‘Alert Severity’.
While adding the alert.
While editing the alert.
Recurring Time
Recurring time allow users to add a difference in time duration of the alert being notified. When the user adds recurring time, alert will be notified only when user defined recurring time has exceeded from the previous notification.
E.g. When user adds Response Time alert with periodicity 5 mins, sampling period 5 mins and recurring time 10 mins with following severity condition:
Sev1: Avg Response Time > 60
When severity condition breaches Sev1 alert is raised and notified to the user around 11:00 AM and in the next alert execution cycle based on periodicity (i.e., 11:05AM) the severity condition breaches in this cycle as well.
But the alert will not be notified to user because recurring time specified as 10 mins. If in the upcoming cycle say 11:10 AM if the severity condition is still breached, then the alert will be raised and notified to the user.
Recurring time while adding or editing the alert.
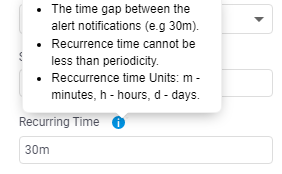
As shown in the above image text box is provided to add ‘Recurring Time’ It can be in Minutes, Hours, or Days.
How to add recurring time in alert.
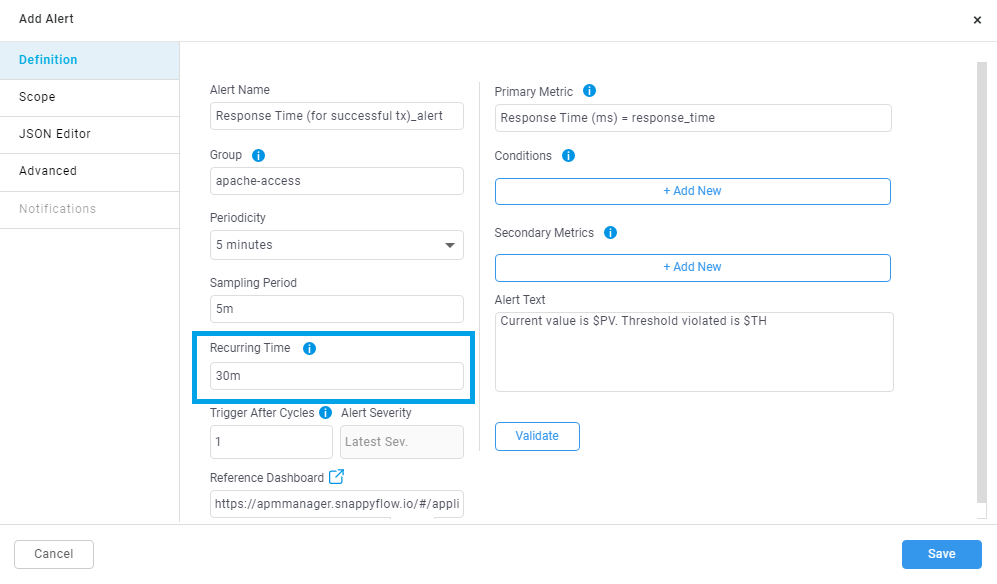
By default, ‘Recurring Time’ will be always 30m while adding the alert as shown in the below image.
Let’s consider an alert with Periodicity set at 5mins, and Recurring time set to default 30mins. Once the specific alert is triggered, system will not notify for another 30mins, even if the alert condition is met. This is done to reduce the frequency of alerts being notified.
As shown in the below image while adding or editing the alert you can use text box provided as ‘Recurring Time’ to add recurring time in Minutes, Hours, or Days.
While adding the alert.
While editing the alert.
Snooze Alert
Snooze alert will enable the user to snooze or stop an alert being notified for the time duration specified. Irrespective of the alert conditions being met, the alert will not be active during this snooze duration. The alert will be enabled once the snooze duration expires.
Let’s consider a situation where an user has planned for a system maintenance which will take approx. 4 hours. During this while the system might come across various corner conditions and many system parameters might be crossing their respective threshold values. This can consequently trigger a lot of unimportant alerts. To overcome this situation, Snoozing an alert can avoid unwanted panic within the system.
How to snooze alerts.
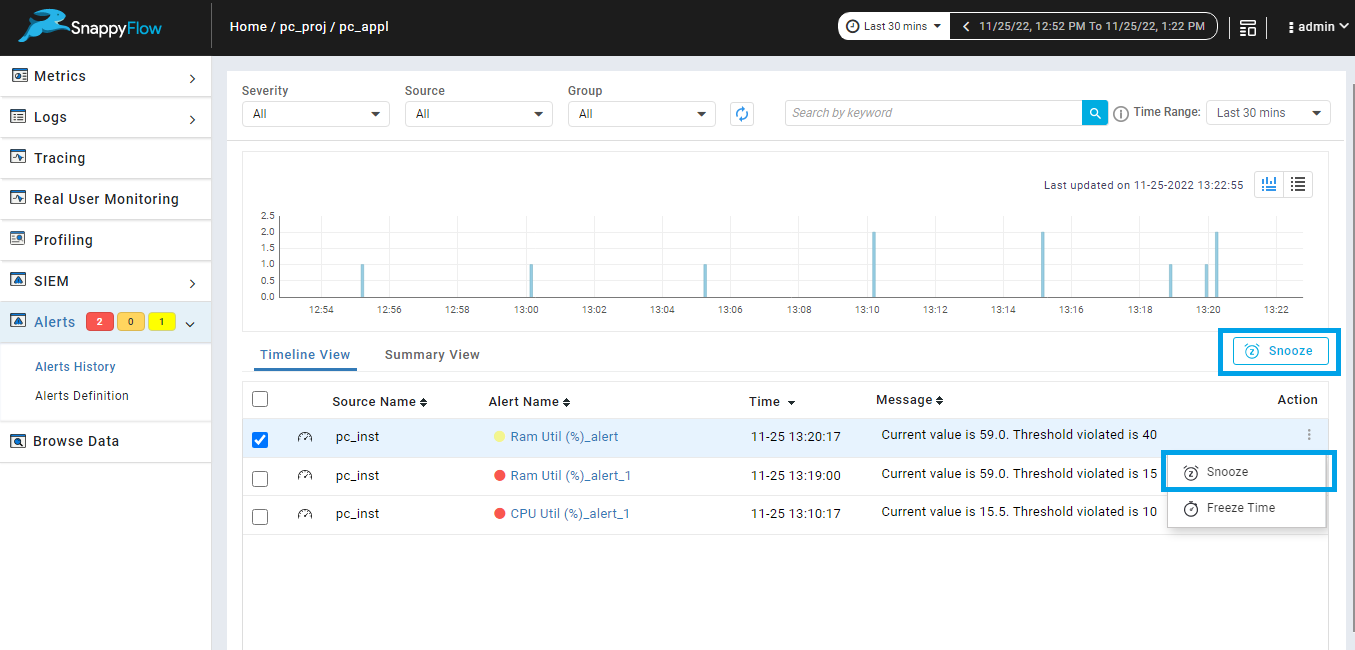
Alerts can be snoozed from alert history page. Option is provided to snooze single alert, or you can select multiple alerts and snooze alerts as shown in the below image.
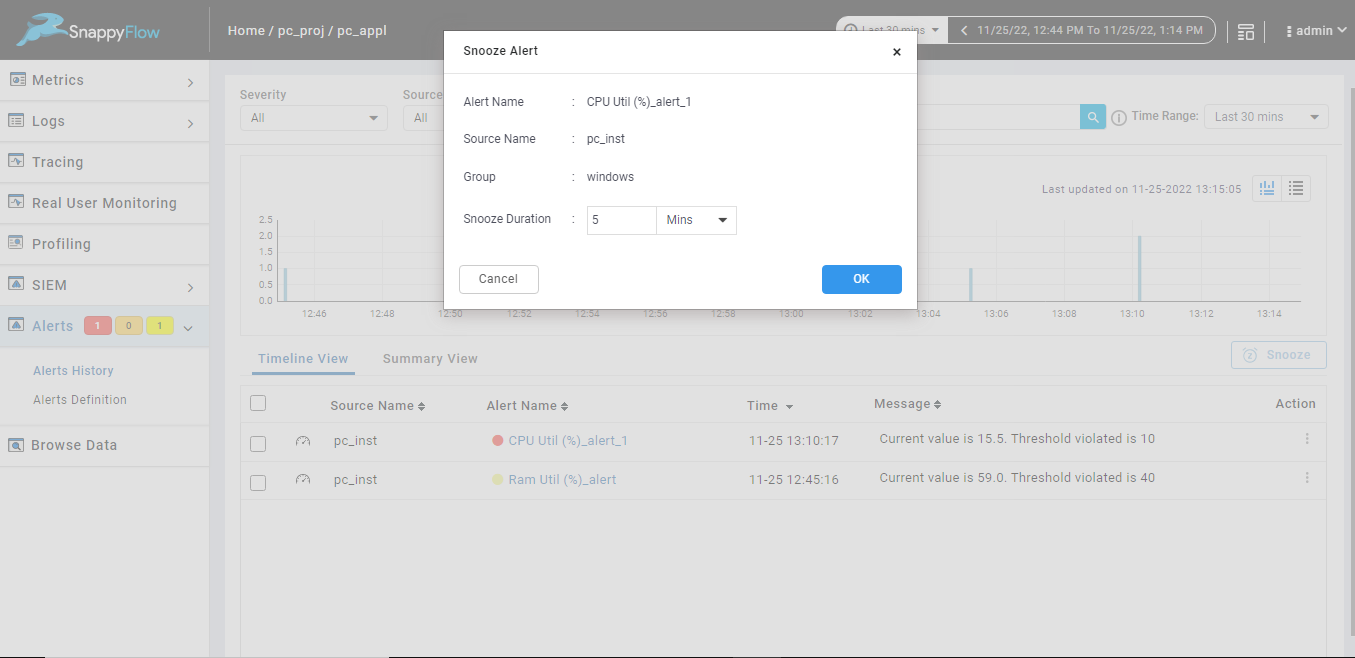
Snoozing single alert from alert history page.
When you snooze a single alert from the alert history page, details such as Alert Name, Source Name, Group and Snooze Duration are displayed. The Snooze Duration by default is set to 5 Mins. User can change the duration to Minutes, Hours, and Days.
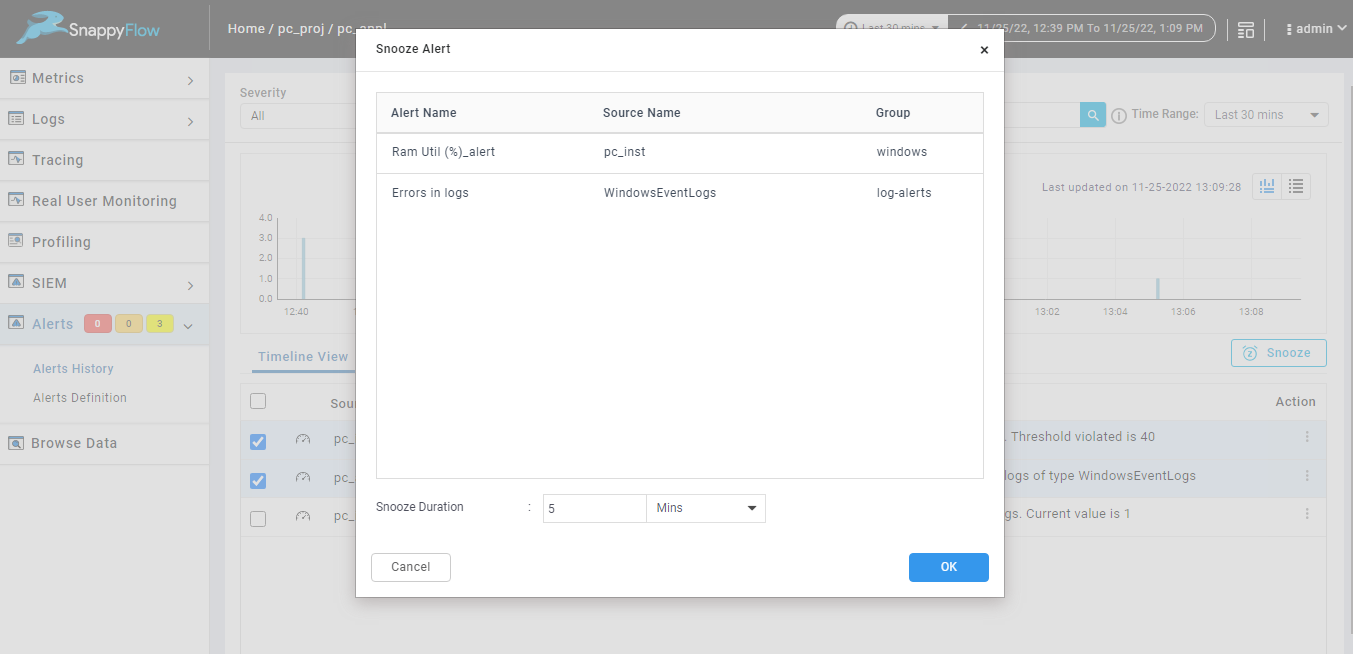
Bulk snooze in alert history page.
When you snooze multiple alerts using the Snooze option from the alert history page, details such as Alert Name, Source Name, Group and Snooze Duration are displayed. The Snooze Duration by default is set to 5 Mins. User can change the duration to Minutes, Hours and Days, and this will be reflected for all alerts selected.
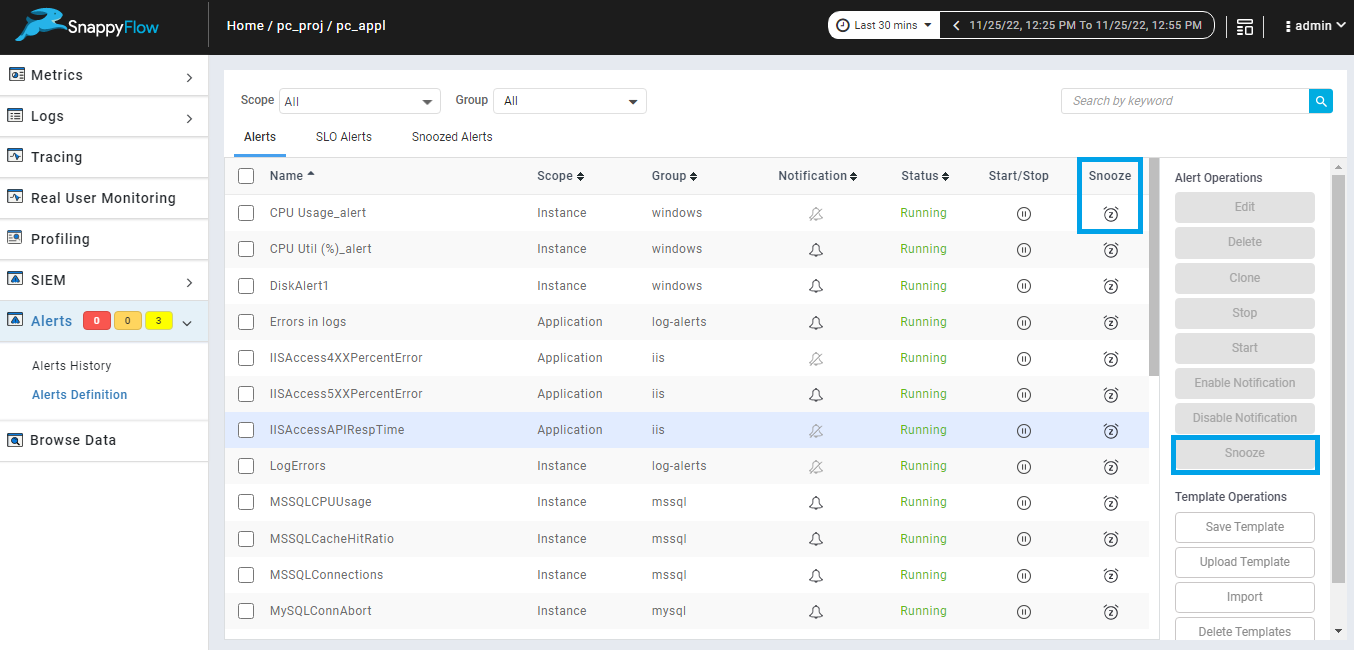
Alerts also can be snoozed from alert definition page. Option is provided to snooze single alert, or you can select multiple alerts and snooze alerts as shown in the below image.
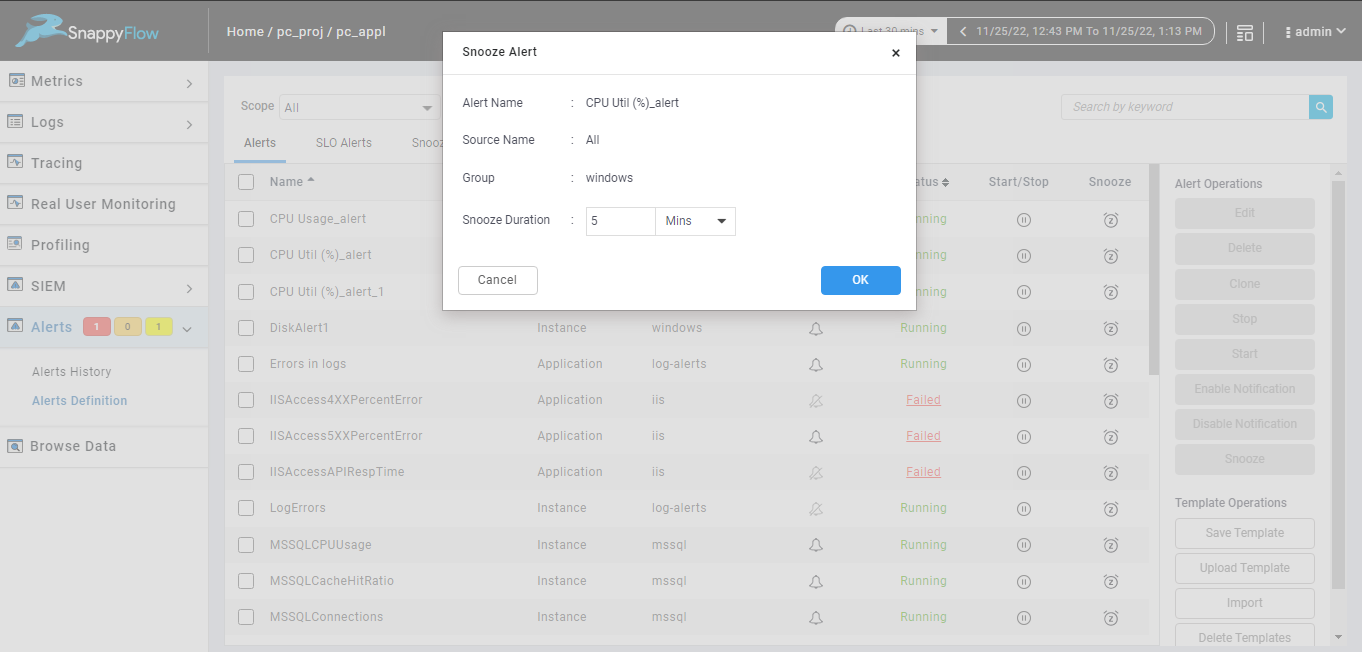
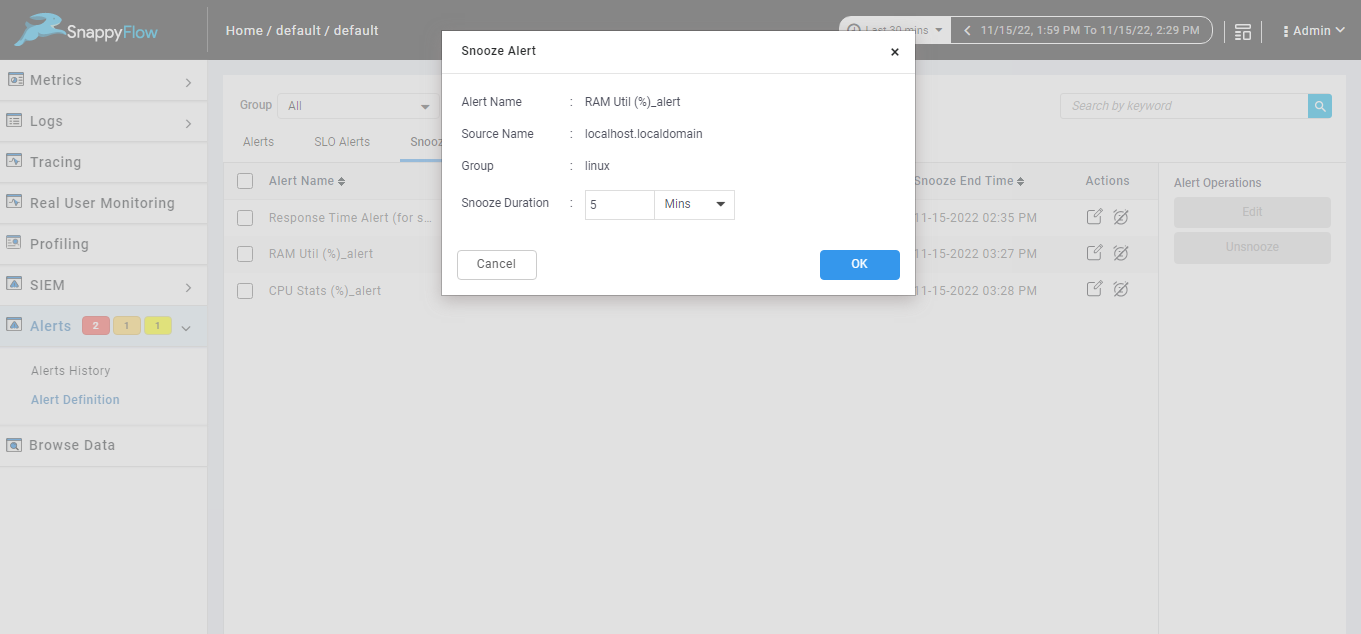
Snoozing single alert from alert definition page.
When you snooze single alert from alert definition page alert name, source name, group of the selected alert will be display and you must add the duration to snooze the selected alert, duration can be Minutes, Hours, Days.
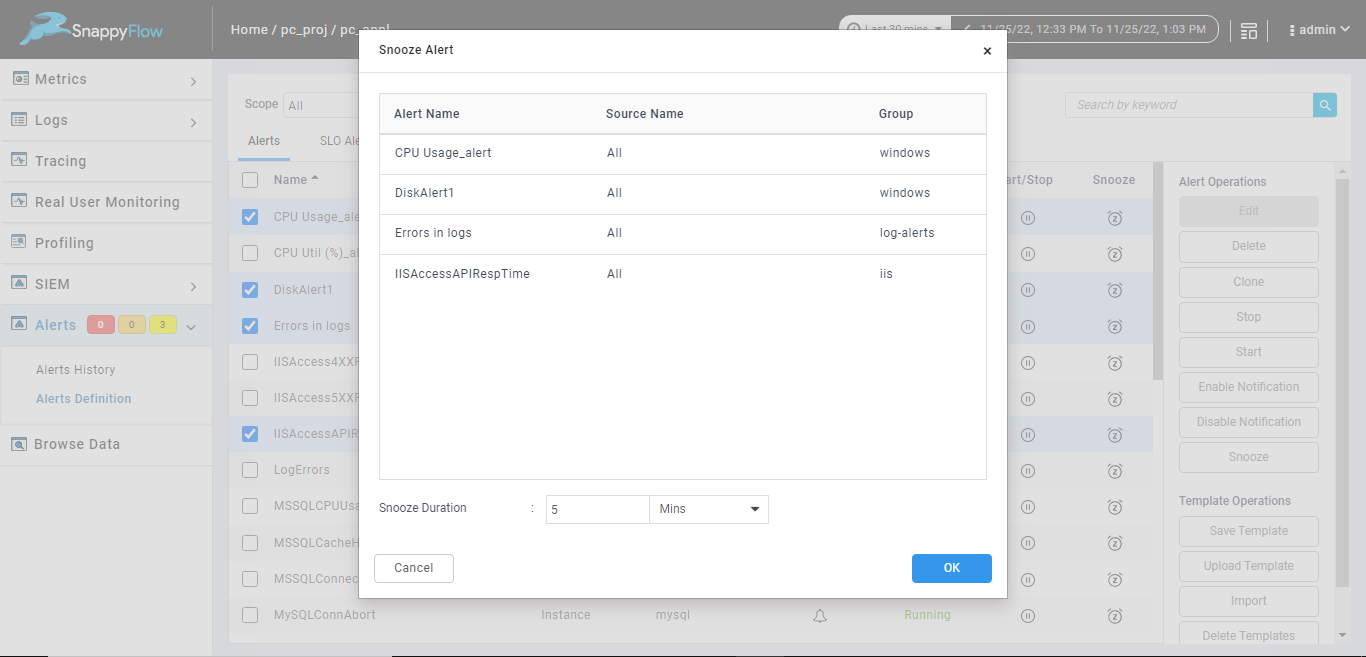
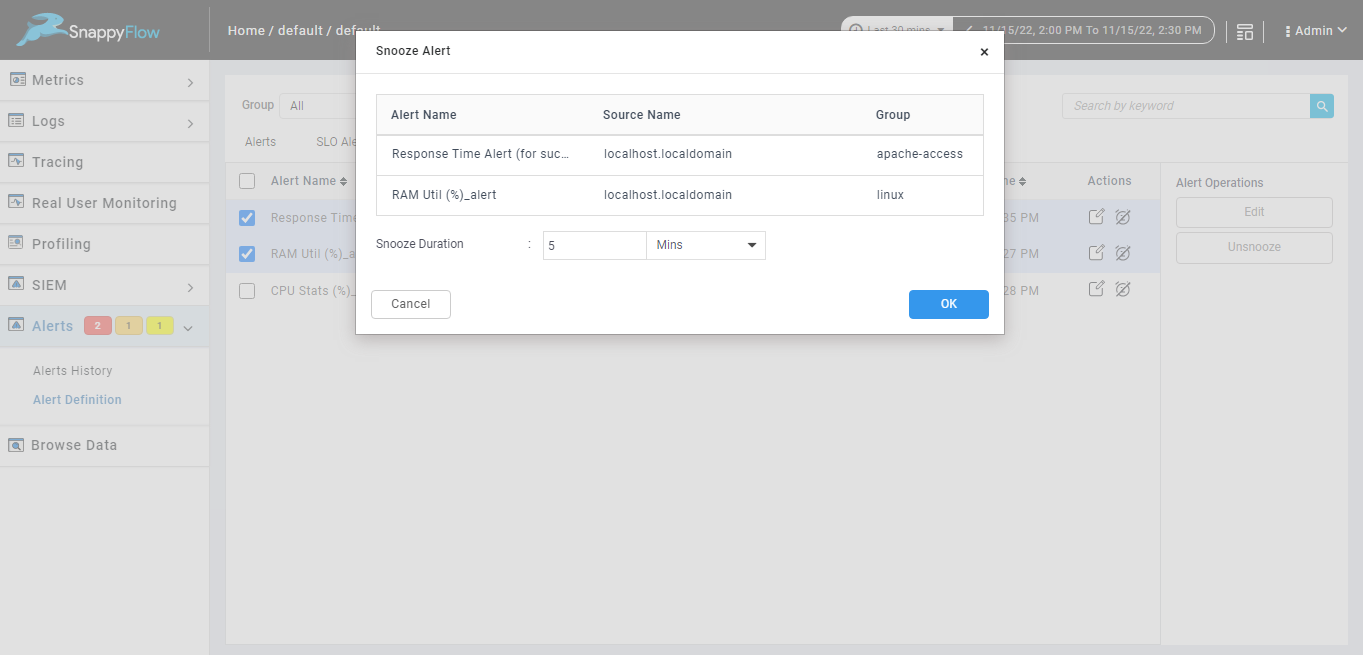
Bulk snooze in alert definition page.
When you snooze multiple alerts by using snooze option from alert definition page alert name, source name, group for all the selected alerts will be listed and you must add the duration to snooze the alert, duration can be Minutes, Hours, Days. The same duration will be applicable for all listed alerts as shown in the below image.
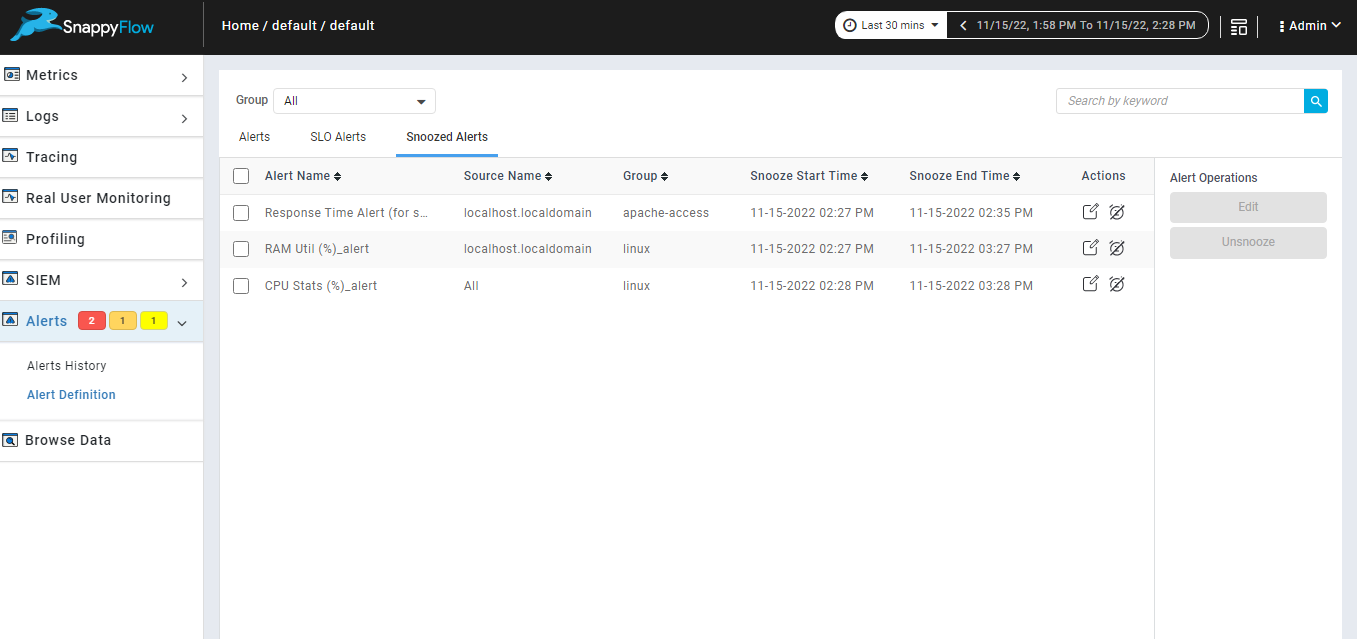
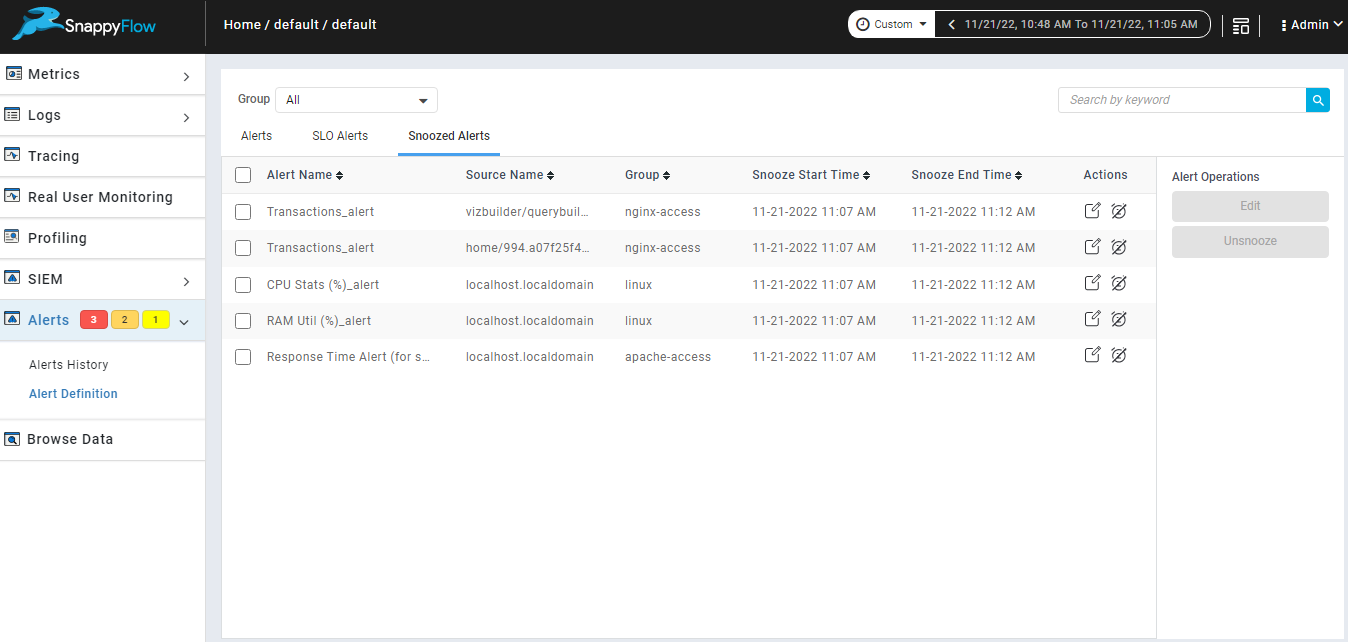
Snoozed alerts tab.
Snoozed alerts tab is available in alert definition page, which contains details of all snoozed alerts which are snoozed from alert history or alert definition page i.e., alert name source name, group, snooze start time and snooze end time.
Edit Snoozed alerts.
We can edit duration of single or multiple snoozed alerts in snoozed alert tab using the option provided in snoozed alert tab as shown in the below image.
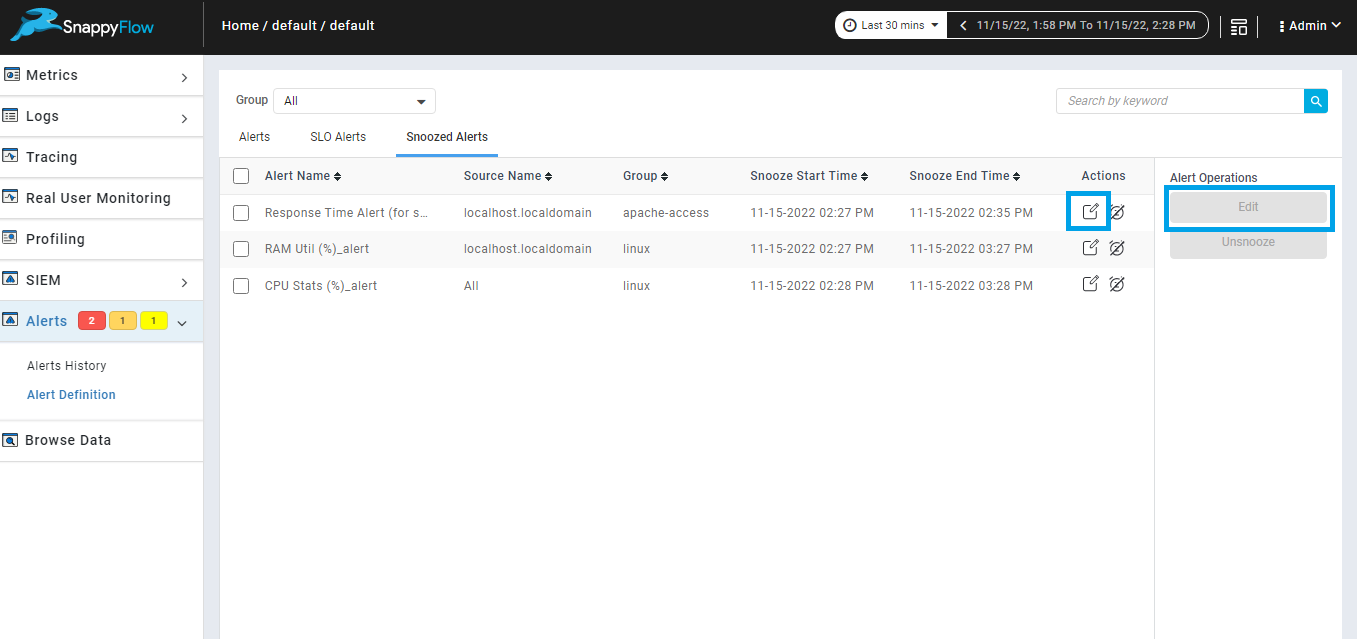
Edit single snoozed alert.
We can edit duration of single snoozed alert from snoozed alerts tab using edit icon from action column.
Edit multiple snoozed alerts.
We can edit duration of multiple snoozed alert from snoozed alerts tab using edit button from alert operations.
Unsnooze snoozed alerts.
We can unsnoozed single or multiple snoozed alerts in snoozed alert tab using the option provided in snoozed alert tab as shown in the below image.
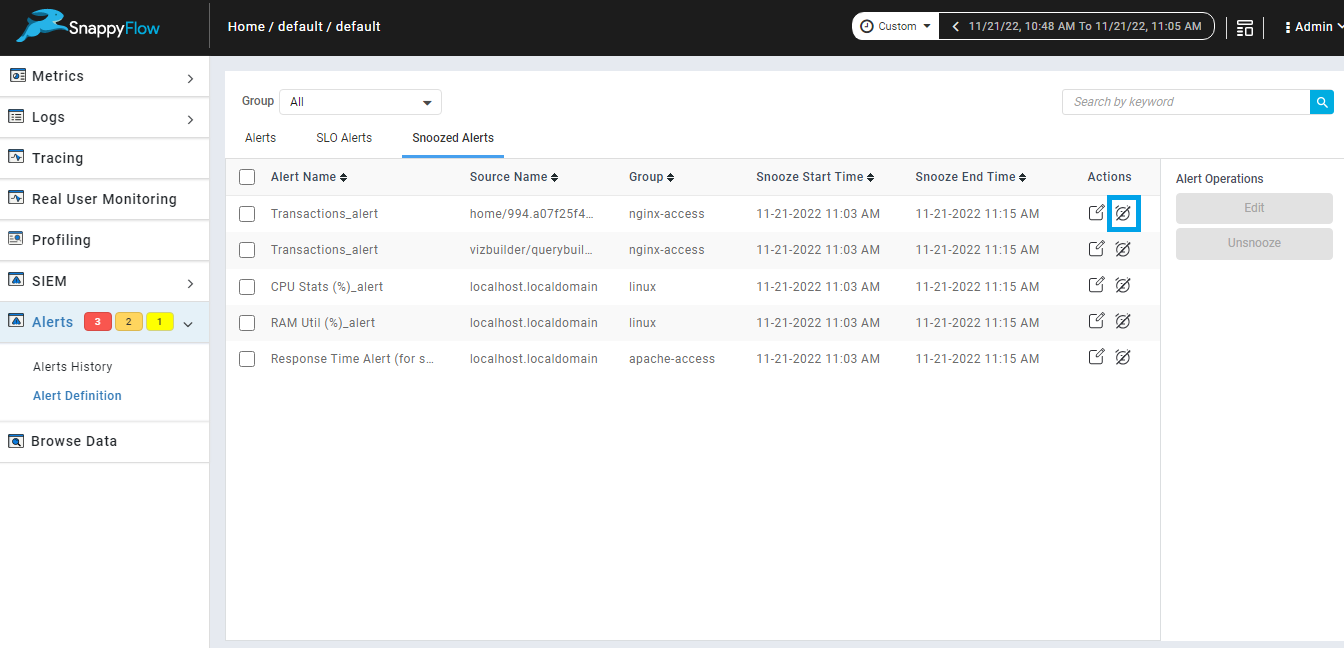
Unsnooze single snoozed alert.
We can unsnooze single snoozed alert from snoozed alerts tab using unsnooze icon from action column.
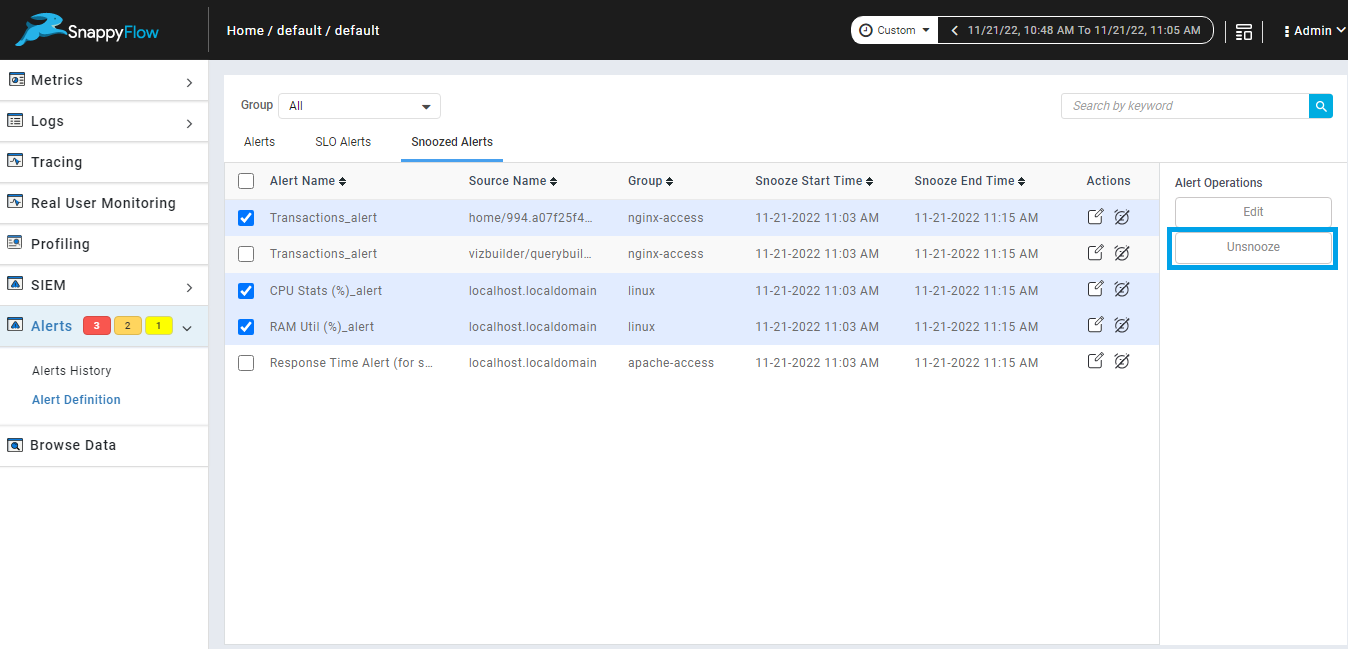
Unsnooze multiple snoozed alerts.
We can unsnooze multiple snoozed alert from snoozed alerts tab using unsnooze button from alert operations.
System Alert
System Alerts are pre-configured alerts that are triggered when the sfagent is unable to reach an instance or application and unable to monitor a plugin within an instance or application. The users have access to temporarily snooze the system alert, but it is not possible to fully disable the system alerts.
Severity Level: By default, the severity level of a system alert is 1.
Use Cases
System alert is generated only during the below-mentioned use cases.
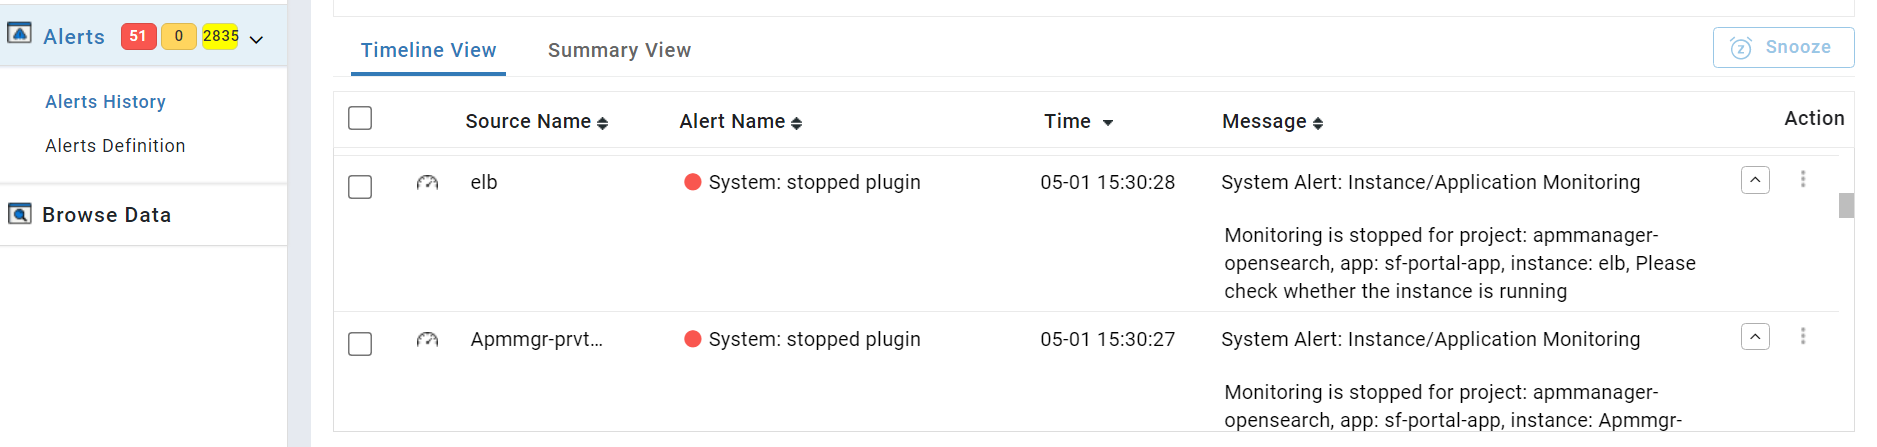
Case 1: Monitoring of an instance or application is stopped. This implies that the sfagent couldn't gather data from any of the plugins present within the instance or application. The reason for this could be that the monitored instance or application has been stopped.
Frequency: System alerts for this case will be notified 3 times with a interval period of 60 mins.
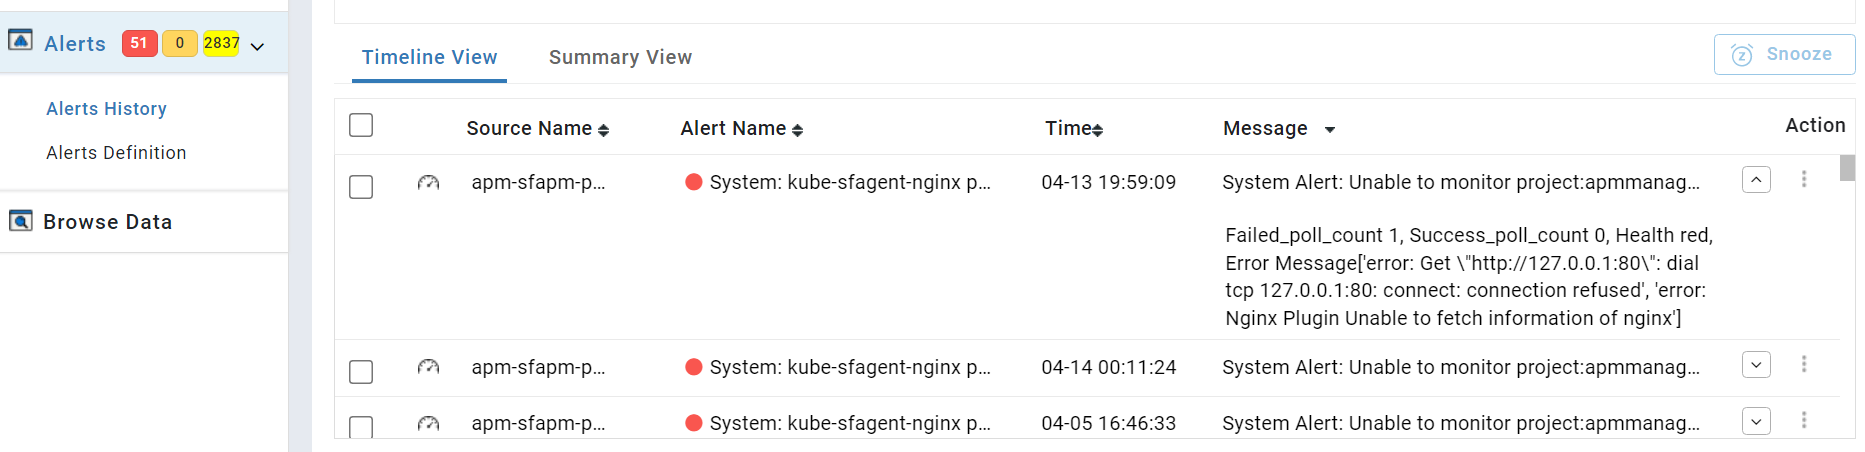
In this use case, the message column contains:
Alert type - System Alert
Alert statement - Instance or Application Monitoring
Project Name, Application Name, Instance Name
Alert Message - Monitoring is stopped. Please check whether the instance is running
Case 2: The sfagent is unable to monitor a particular plugin within the instance or application.
Frequency: System alerts for this case will be notified at a regular interval of 30 mins.
In this use case, the message column contains:
Alert type - System Alert
Alert statement - Unable to monitor
Project Name, Application Name, Service Name, Plugin Name
Alert Message - A detailed error message will be given.