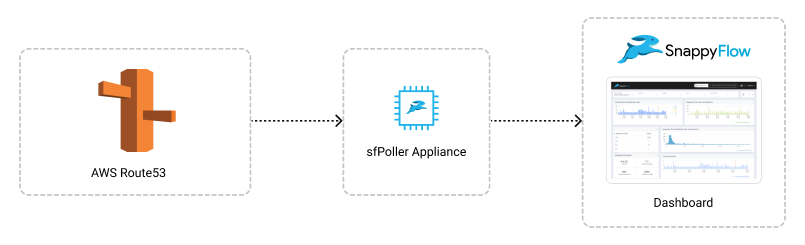
Monitor AWS Route53
Overview
Amazon Route 53 is a highly available and scalable Domain Name System (DNS) web service. Route 53 is used to perform three main functions in any combination: domain registration, DNS routing, and health checking. The Route53 plugin enables you to monitor the performance of Route53 by gathering metrics and its functions using sfPoller and display the metrics within SnappyFlow dashboard.
Prerequisites
To collect metrics from Route53, it is necessary to have an IAM Role with CloudWatch access and sfPoller set up within your AWS environment. Click here to learn more about setting up sfPoller in your AWS environment.
Required Permissions
- AmazonRoute53ReadOnlyAccess
- CloudWatchReadOnlyAccess
Configure sfPoller to Collect Metrics
Follow the below step to add endpoints and plugins in sfPoller.
Go to the Application tab of sfPoller and navigate to your Project > Application.
Select the Application, it will take you to the
Endpointpage.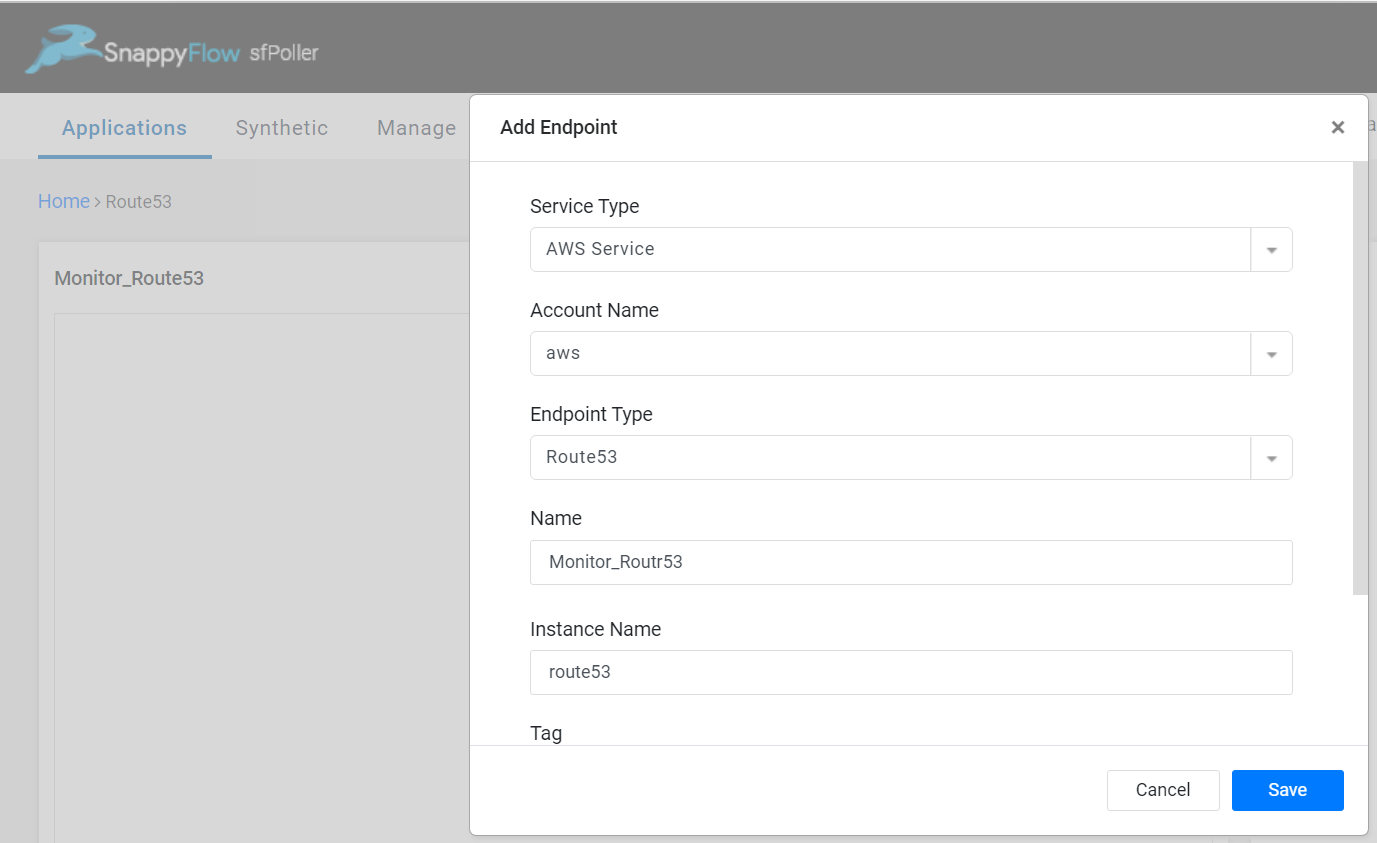
In the Endpoint page, select the
Add Endpointbutton, add the following data, and save.- Service Type: Select
AWS Service - Account Name: Select
aws - Endpoint Type: Select
Route53 - Name: Give a name to the endpoint
- Instance Name: Give the instance name
- Service Type: Select
In the Plugins window, select the
+Addbutton.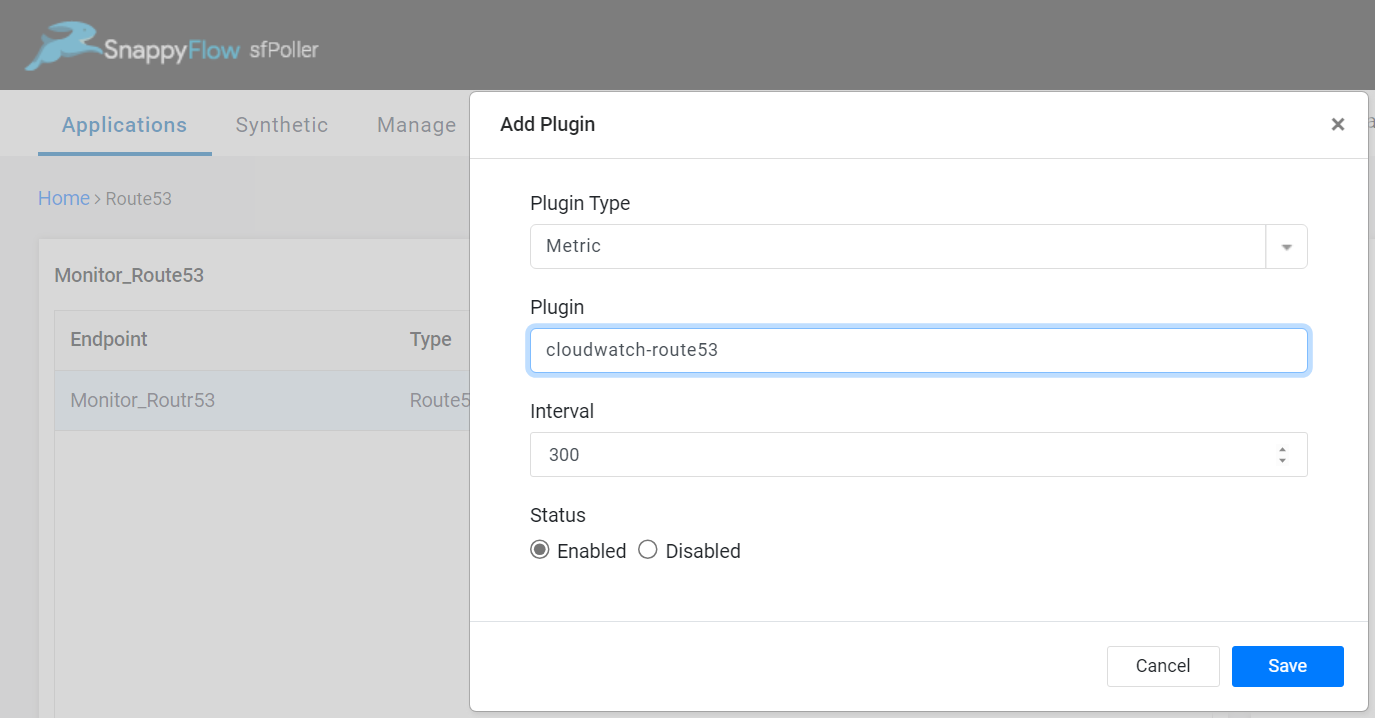
In the Add Plugin window, select the below details and save.
- Plugin Type: Select
Metric - Plugin: Select
cloudwatch-route53 - Interval: Choose an interval value. The minimum value for the interval is 300
- Status: By default, the status is
Enabled
- Plugin Type: Select
Click the global
Savebutton in the window's top right corner to save all the changes made so far.
View AWS Route53 Metrics
Follow the below steps to view the metrics collected from Route53.
Go to the Application tab in SnappyFlow and navigate to your Project > Application > Dashboard.
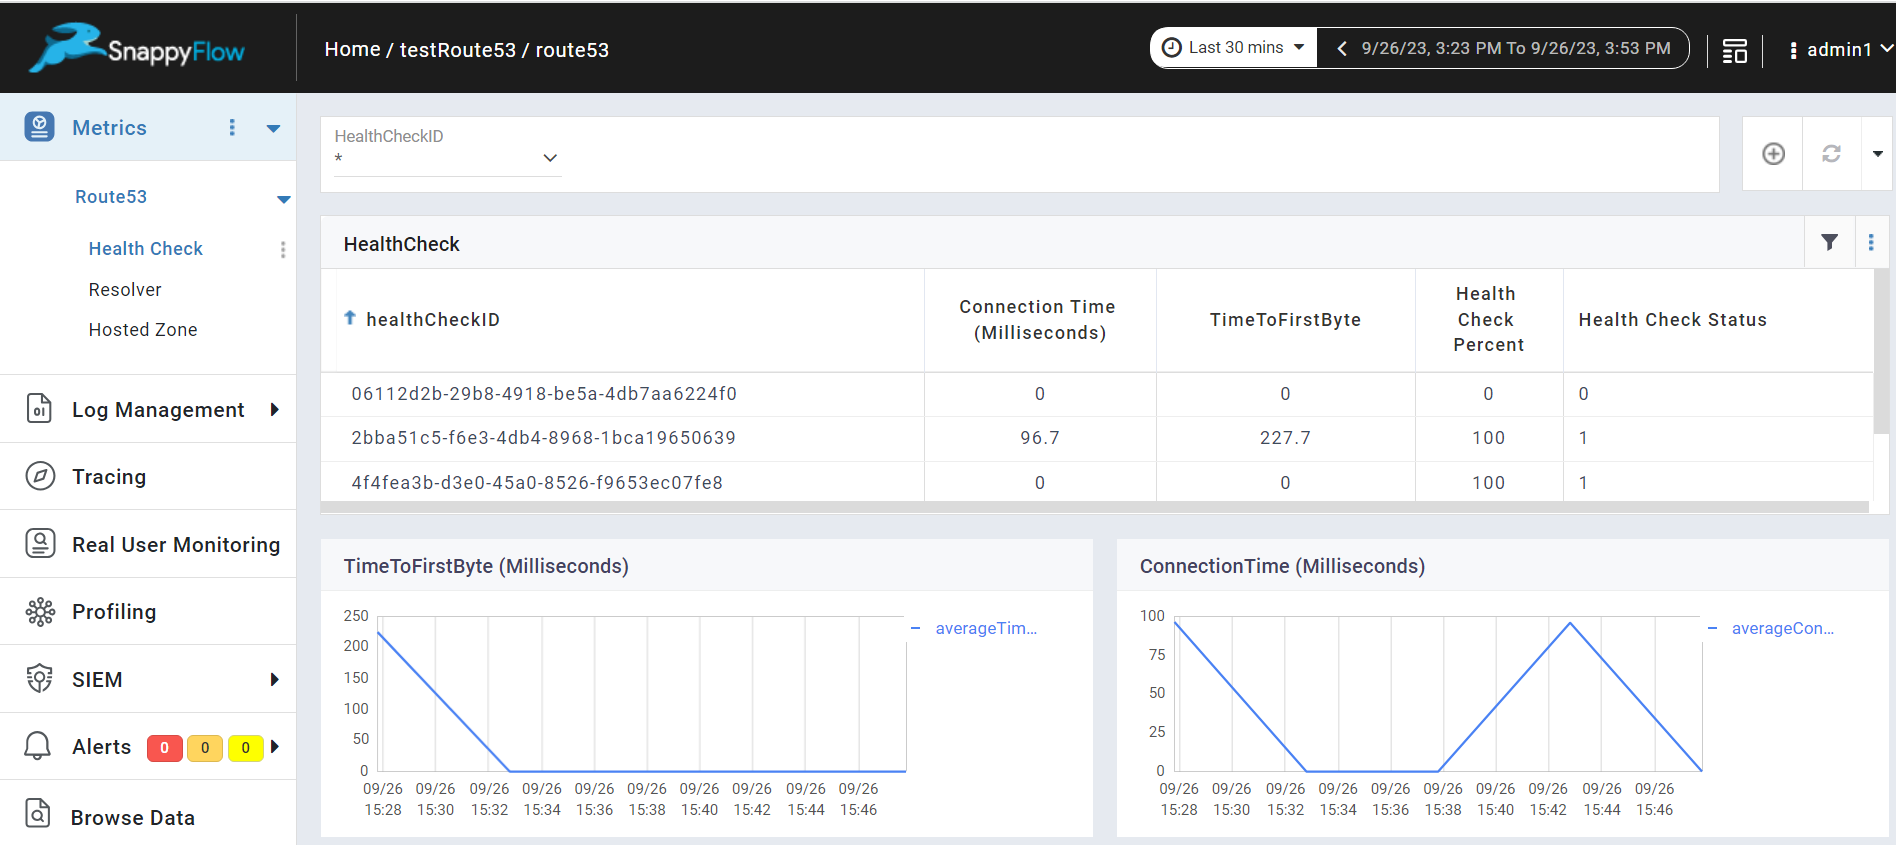
You can view the Route53 metrics in the Metrics section.
Once plugin is added to sfPoller, they will be automatically detected within the Metrics section. However, if the plugins are not detected, you can import template to view the corresponding metrics.
- To access the unprocessed data gathered from the plugins, navigate to the Browse data section and choose the
Index: Metric,Instance: Endpoint,Plugin,andDocument Type.
Template Details
| Template | Plugin | Document Type | Description |
|---|---|---|---|
| Route53 | cloudwatch-route53 | healthCheckMetrics, hostedZoneMetrics, resolverEndpointMetrics | Collects metrics from Route53 |
Metric List
Health Check Metrics
| Metric | Description |
|---|---|
| ConnectionTime | The average time, in milliseconds, that it took Route 53 health checkers to establish a TCP connection with the endpoint. |
| HealthCheckPercentageHealthy | The percentage of Route 53 health checkers that consider the selected endpoint to be healthy. |
| HealthCheckStatus | The status of the health check endpoint that CloudWatch is checking. 1 indicates healthy, and 0 indicates unhealthy. |
| SSLHandshakeTime | The average time, in milliseconds, that it took Route 53 health checkers to complete the SSL handshake. |
| TimeToFirstByte | The average time, in milliseconds, that it took Route 53 health checkers to receive the first byte of the response to an HTTP or HTTPS request. |
Hosted Zone Metrics
| Metric | Description |
|---|---|
| DNSQueries | For all the records in a hosted zone, the number of DNS queries that Route 53 responds to in a specified time period. |
| DNSSECInternalFailure | Value is 1, if any object in the hosted zone is in an INTERNAL_FAILURE state. Otherwise, value is 0. |
Resolver Endpoint Metrics
| Metric | Description |
|---|---|
| EndpointHealthyENICount | The number of elastic network interfaces in the OPERATIONAL status. This means that the Amazon VPC network interfaces for the endpoint (specified by EndpointId) are correctly configured and able to pass inbound or outbound DNS queries between your network and Resolver. |
| InboundQueryVolume | For inbound endpoints, the number of DNS queries forwarded from your network to your VPCs through the endpoint specified by EndpointId. |
| OutboundQueryVolume | For outbound endpoints, the number of DNS queries forwarded from your VPCs to your network through the endpoint specified by EndpointId. |
| OutboundQueryAggregateVolume | For outbound endpoints, the total number of DNS queries forwarded from Amazon VPCs to your network. |