Memory
Heap Analysis
Pre-requisites
- Install Java - JDK 11
- Install sfAgent on Linux
- Add profile key and SnappyFlow tags in the config.yaml.
- For existing customers, update SFAgent config.yaml with latest - profile key, if SFAgent is already deployed.
- Name and AppName should always be unique (pair).
- jcmd equivalent : Application Dashboard >> Process Name
Heap Analysis
- Memory profiling provides the heap dump analyses.
- Profiling helps us to identify Memory leaks.
Trigger Heap Dump
Select the project >> application where the instance is monitored
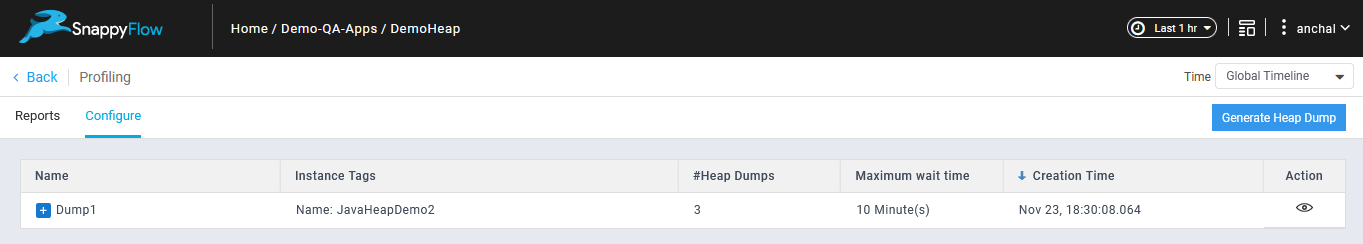
Go to Dashboards >> Click on Profiling pane >> Click on Configure tab >> Generate Heap Dump button
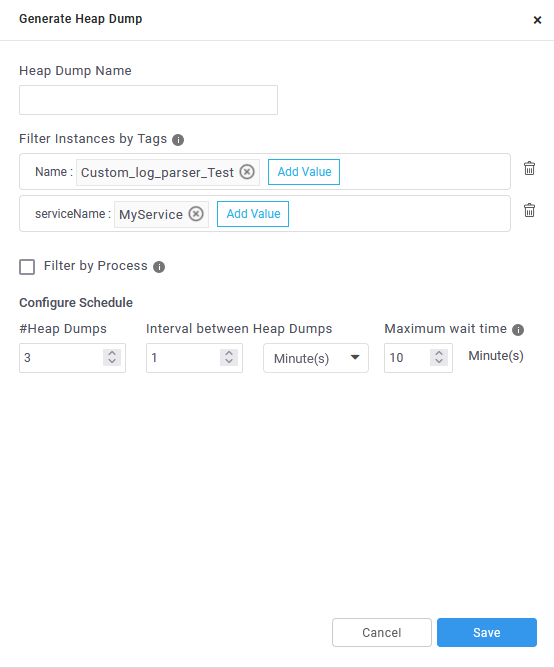
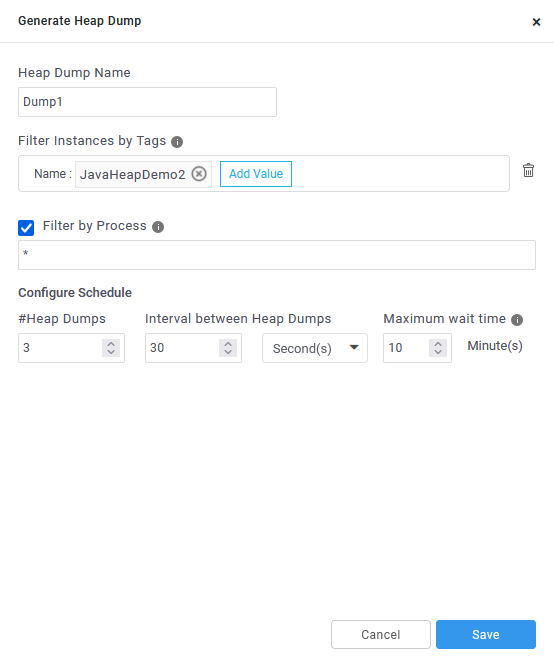
Fill the form with following details :
- Heap Dump Name
- Add tags : Provide the tags keys and tags values used to identify the target instance on the which heap dump needs to be triggered.
- To drill down on the process on which heap dump has to be triggered provide the process name in the process name filter. If nothing is provided heap dump will be triggered on all java process identified by JCMD command.
- In Configure Schedule section :
- #Heap Dumps : indicate the number of heap dumps to be triggered
- Interval between Heap Dumps : indicates the interval between individual heap dumps
- Max wait time : indicates the time duration after which if no response is returned from target instances the command is marked invalid
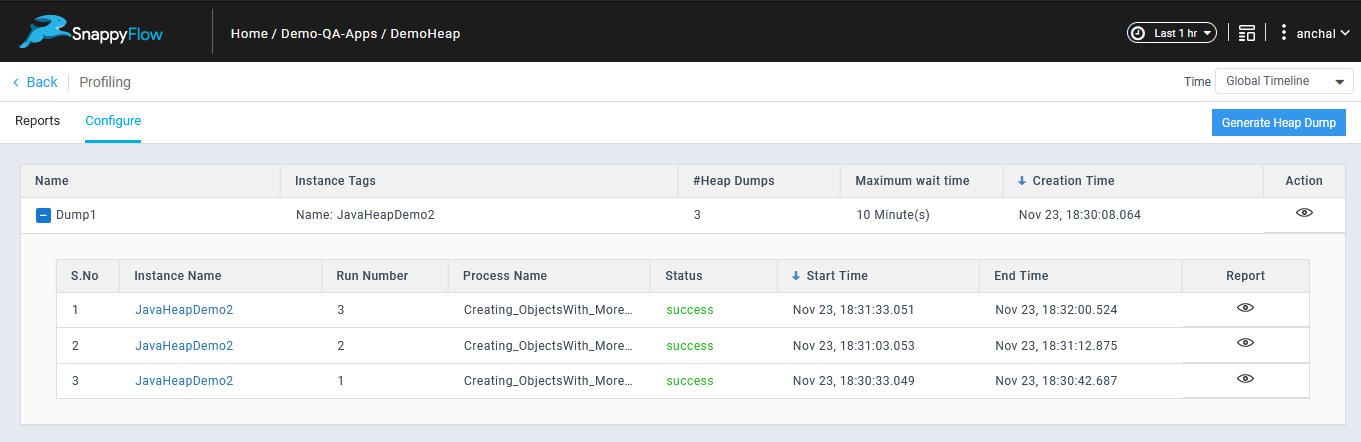
The command status can be viewed on expanding the command.
In the details views, click on the Report icon to view the heap dump report.
Remote Processing
Eventhough if the user opts for remote processing, if the heapdump hprof file size is smaller than or equal to the default maximum supported file size, parsing of reports will be done by agent and normal workflow prevails.The following are the environment variables which user can use to override the default values.
MAXSUPPORTEDSIZEGB: To override the default maximum supported heapdump filesize(15 % of Machine's RAM) (eg: MAXSUPPORTEDSIZEGB=2 for 2GB and MAXSUPPORTEDSIZEGB=2.5 for 2.5GB) in /opt/sfagent/env.conf
CHUNKSIZEMB: To override the default chunksize value (500MB) (eg: CHUNKSIZEMB=1000 for 1GB) in /opt/sfagent/env.conf
MEMORYANALYZERMAXHEAPSIZEGB: To override the default maxheapsize of memoryanalyser.ini(50 % of machine's RAM) (eg: MEMORYANALYZERMAXHEAPSIZEGB=2 for 2GB and MEMORYANALYZERMAXHEAPSIZEGB=2.5 for 2.5GB) in /opt/sfagent/env.conf
RHPSCLIENTTIMEOUTSEC: To override the default RHPS http client timeout (300 Seconds) (eg: RHPSCLIENTTIMEOUTSEC=500 for 500 seconds) in /opt/sfagent/env.conf
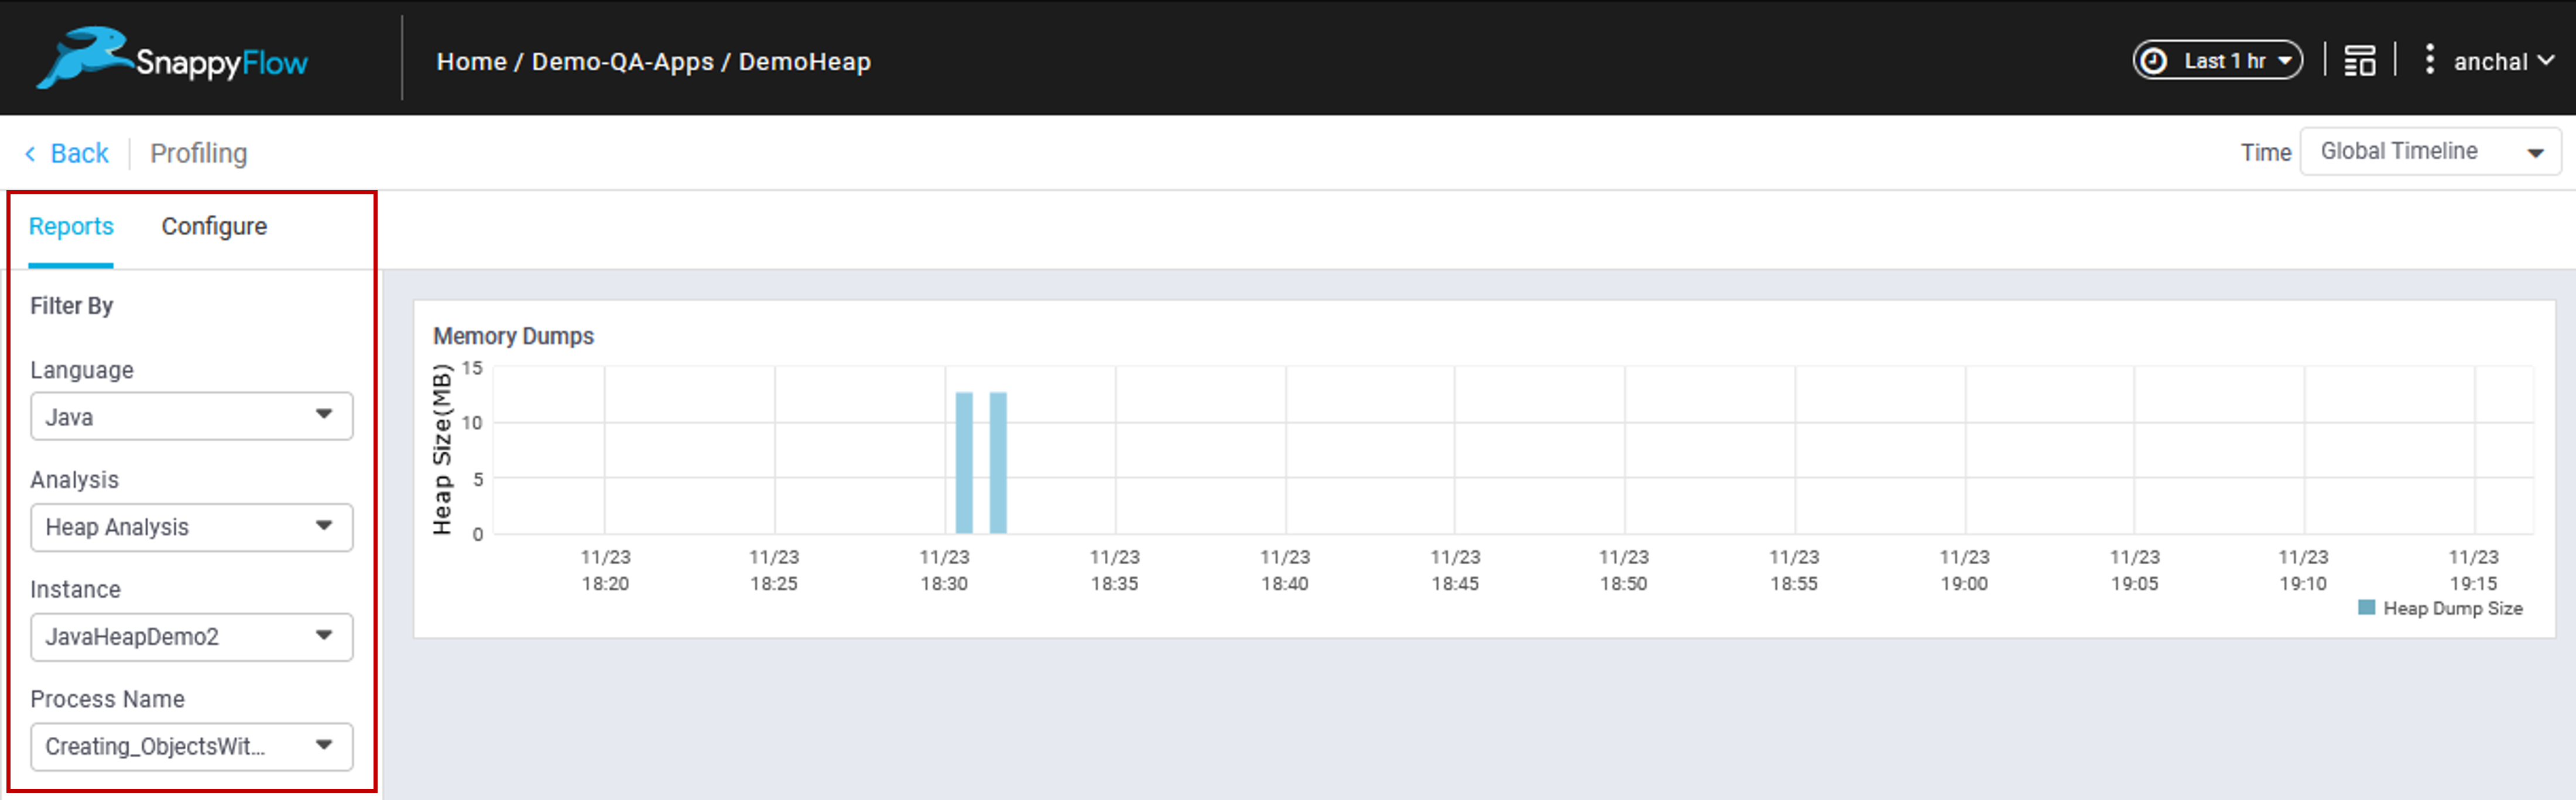
Viewing Reports
- Click on Reports tab in Profiling Pane
- Select the Language as Java
- Select Profiling as Heap analyses
- Select Instance Name from drop down
- Select process Name from drop down
- Select the heapdump from the timeline chart
- Details of the heapdump can be found in the down panel
Heap Analysis Support Size Limits
- Heap analysis is memory and CPU intensive activity.
- Based on the application memory usage heap dump binary size, processing overhead on the system will also increase on the SFAgent w.r.t CPU and memory.
We successfully tested up to 3.3GB of heap dump size on t2.xlarge (4 vCPU, 16 GiB) instance.
- Here are the resources consumption details :
| Java Process Max Heap Size | Eclipse MAT Max Heap Size | Max Dump Size Created | Time Taken To Generate Dump (min.) | Time Taken To Parse Reports (min.) | System’s Max CPU Usage |
|---|---|---|---|---|---|
| 1 GB | 8 GB | 1 GB | 0.1 | 2.34 | 45% |
| 2 GB | 8 GB | 1.7 GB | 0.3 | 3.6 | 65% |
| 3 GB | 8 GB | 3.1 GB | 0.6 | 9.8 | 55% |
| 4 GB | 8 GB | 3.3 GB | 0.6 | 10.5 | 80% |
Java Heap Analysis Troubleshoot Documentation
| Error Message / Status | What does it mean? When and why this occurs? | What action user can take next? |
|---|---|---|
| The listed process is not running | While generating dump if the mentioned java process is not running in the VM this error will occur. | Restart the process after investigation. |
| Unable to get dump exit status 13 | Occurs while processing the heap dump, if the size of the heap dump is beyond supported limit. | Refer the supported size limits. |
| Unknown | If SFAgent is failed to update the heap dump processing status with in the maximum wait time, then SnappyFlow backend treat this as stale entry and mark it as Unknown. | User may increase the “Maximum wait time” while configuring heapdump. |
| stat /opt/sfagent/dump_files/ Dump_file_141295_1638767771354 | If SFAgent fails to locate the heap dump file, after triggering the heap dump this may occur. Possible reason could be process is down. | Restart the process after investigation. |
- Here are the details of plugin, indexes and document types involved in heap analysis feature.
- User can view these documents through browse data feature in SF UI.
| Index | Plugin Type | Document Type(s) |
|---|---|---|
| Heartbeat | HeapDump | Command_Events |
| Profiling | HeapDump | Dominator_Class_stats, Shortest_Paths_To_the_Accumulation_Point_stats, class_usage_stats, heap_dump_overview_stats, leak_suspects_stats, All_Accumulated_Objects_by_Class_stats |
Screenshots
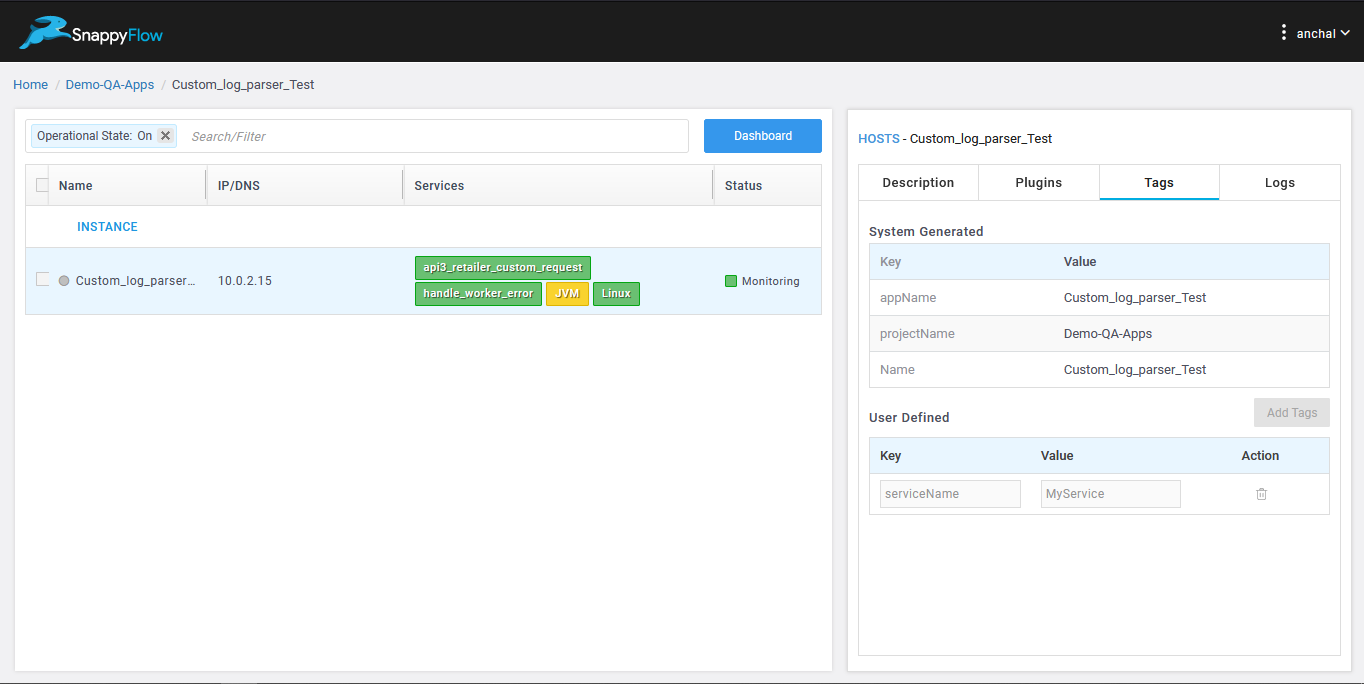
List of tags which will be used to filter instances.
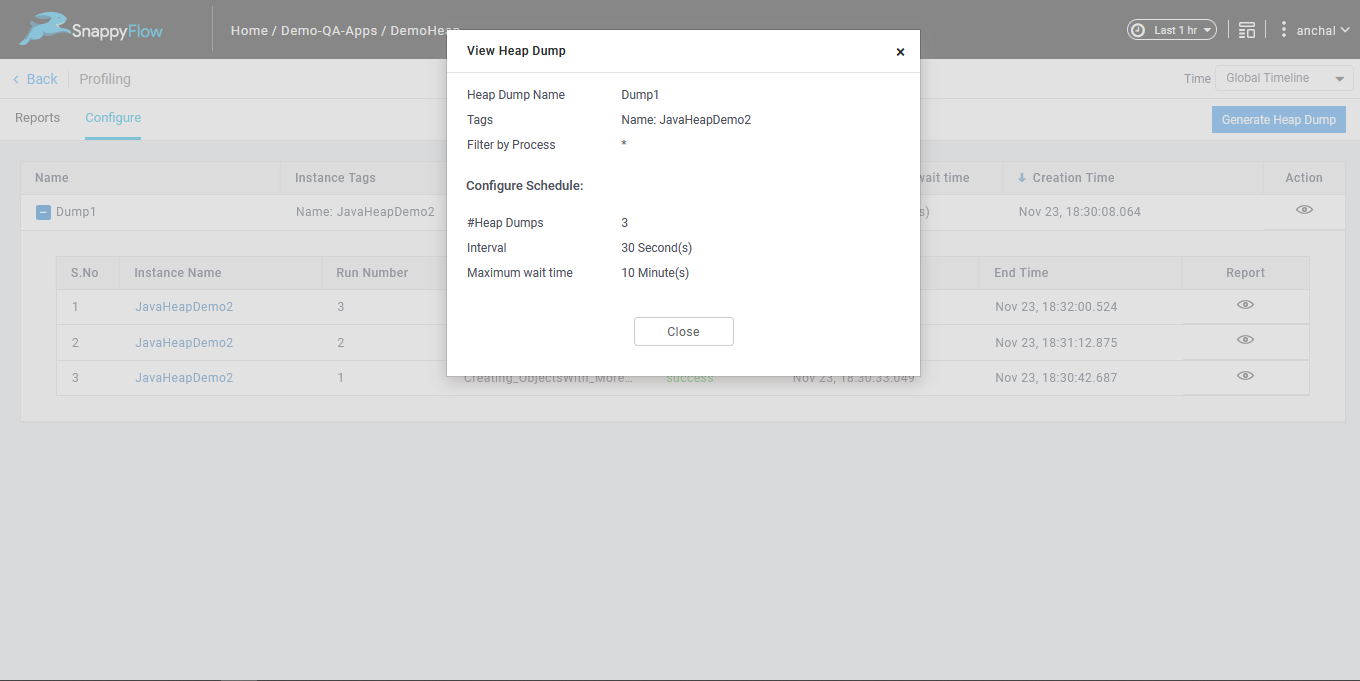
Dashboard >> Profiling >> Configure >> Generate Heap Dump
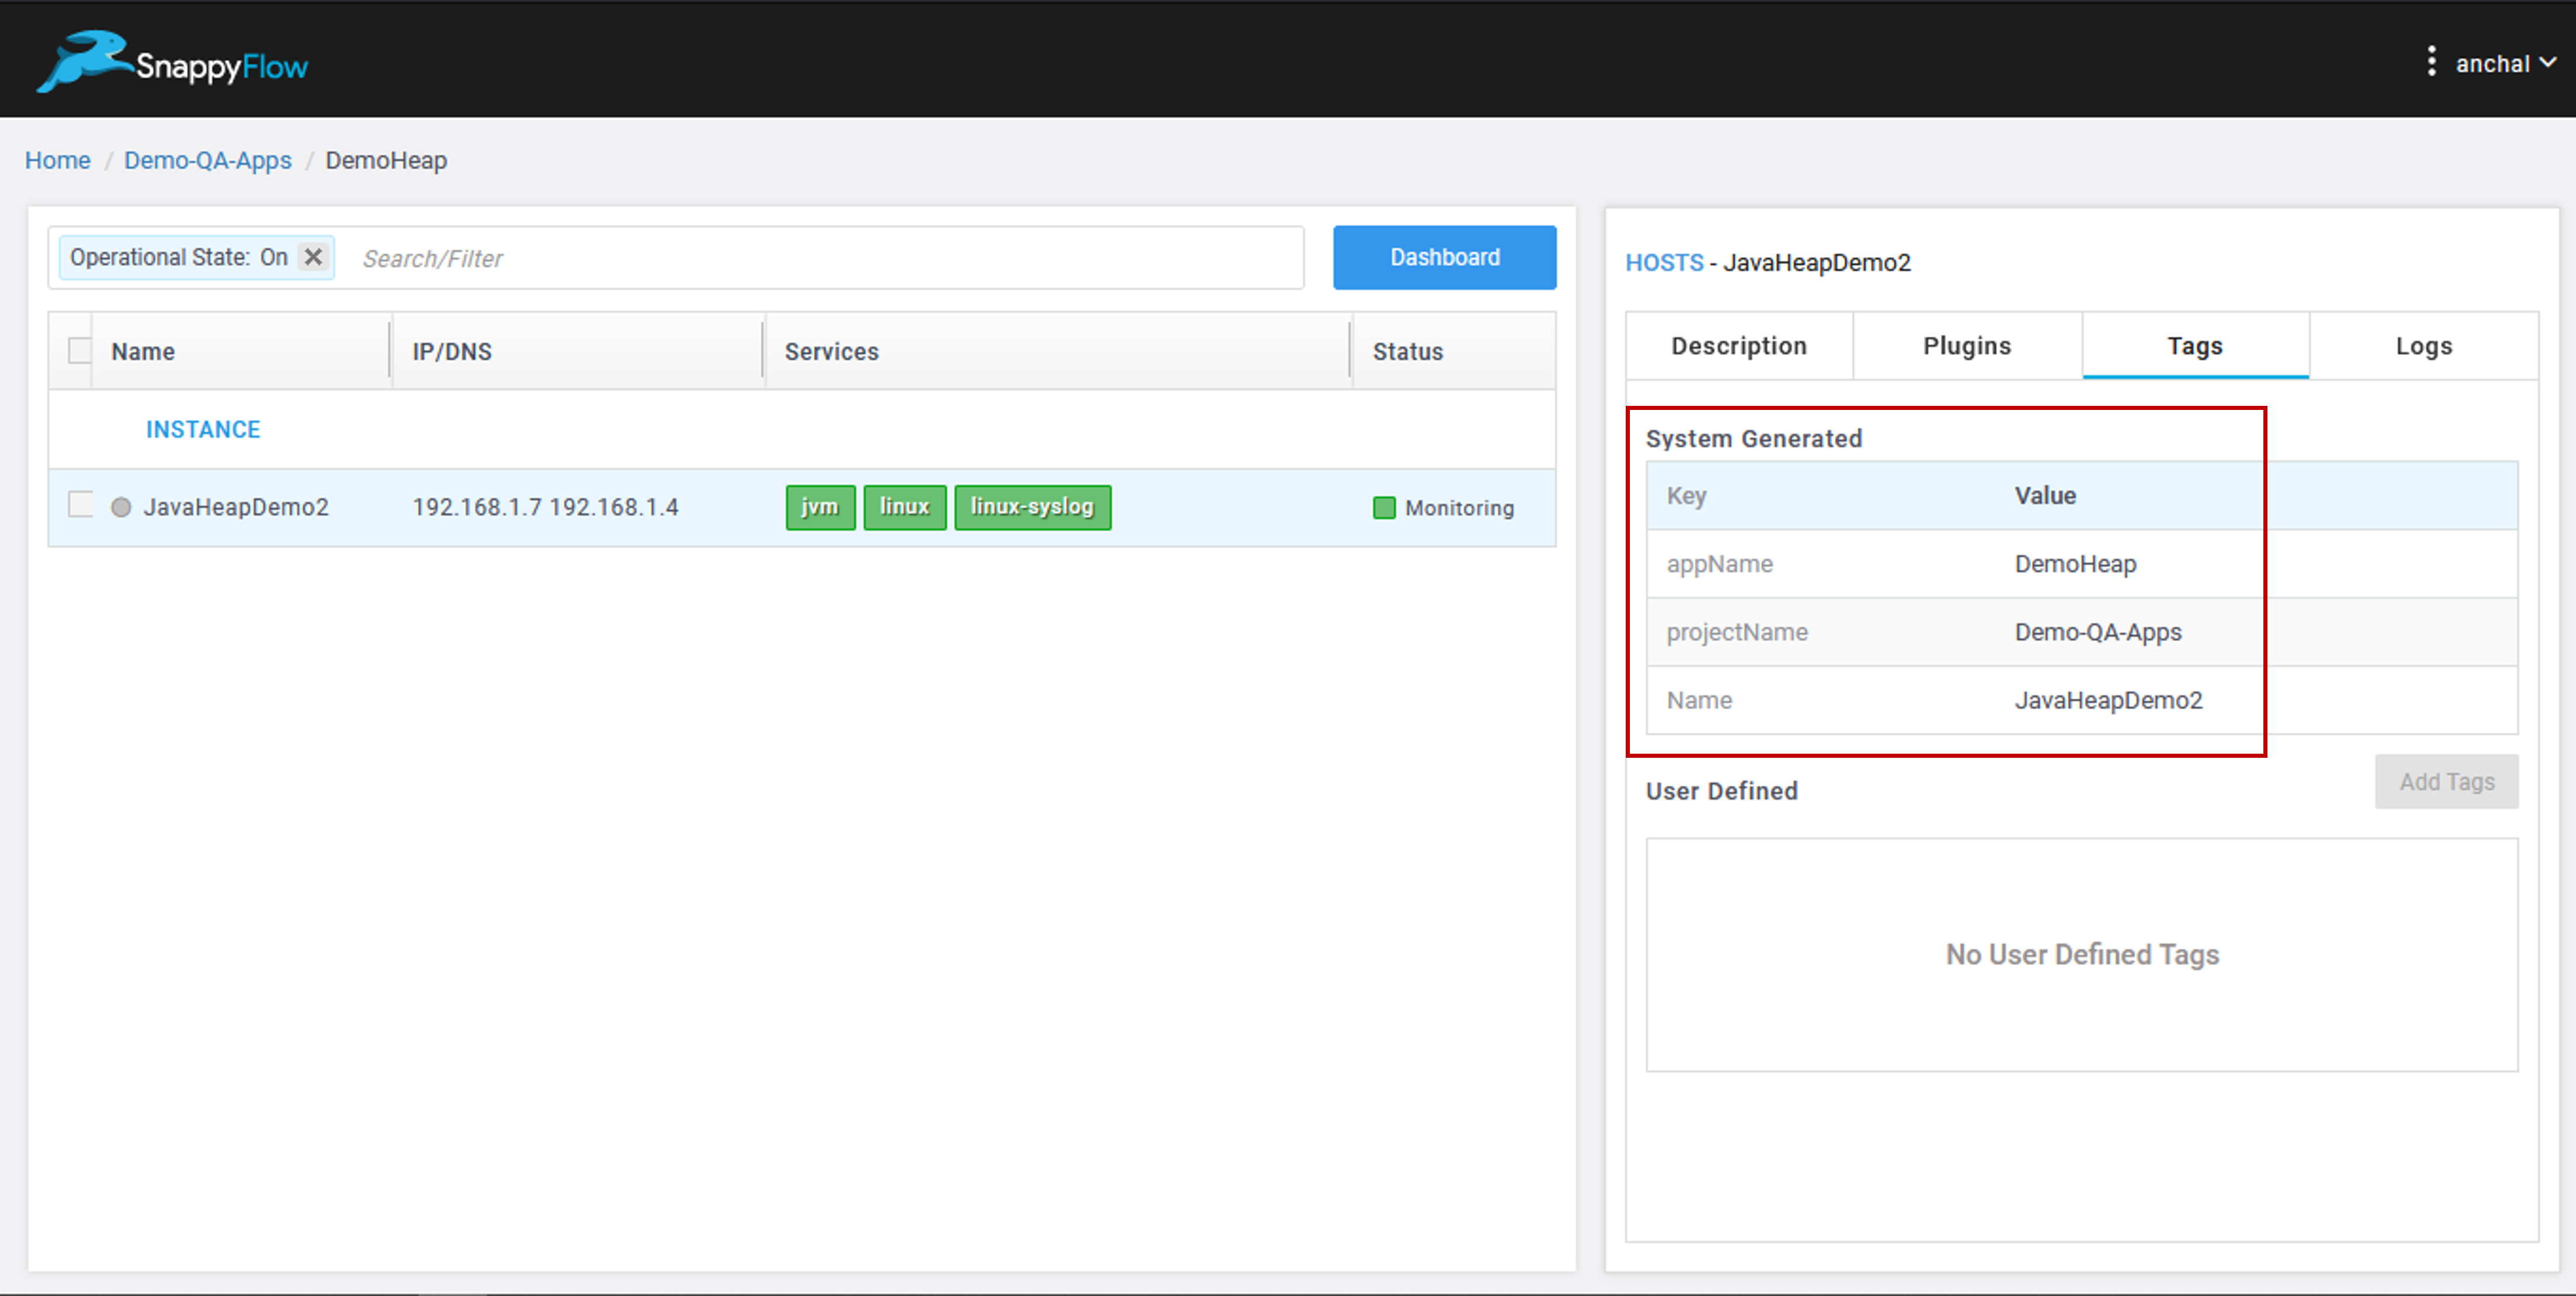
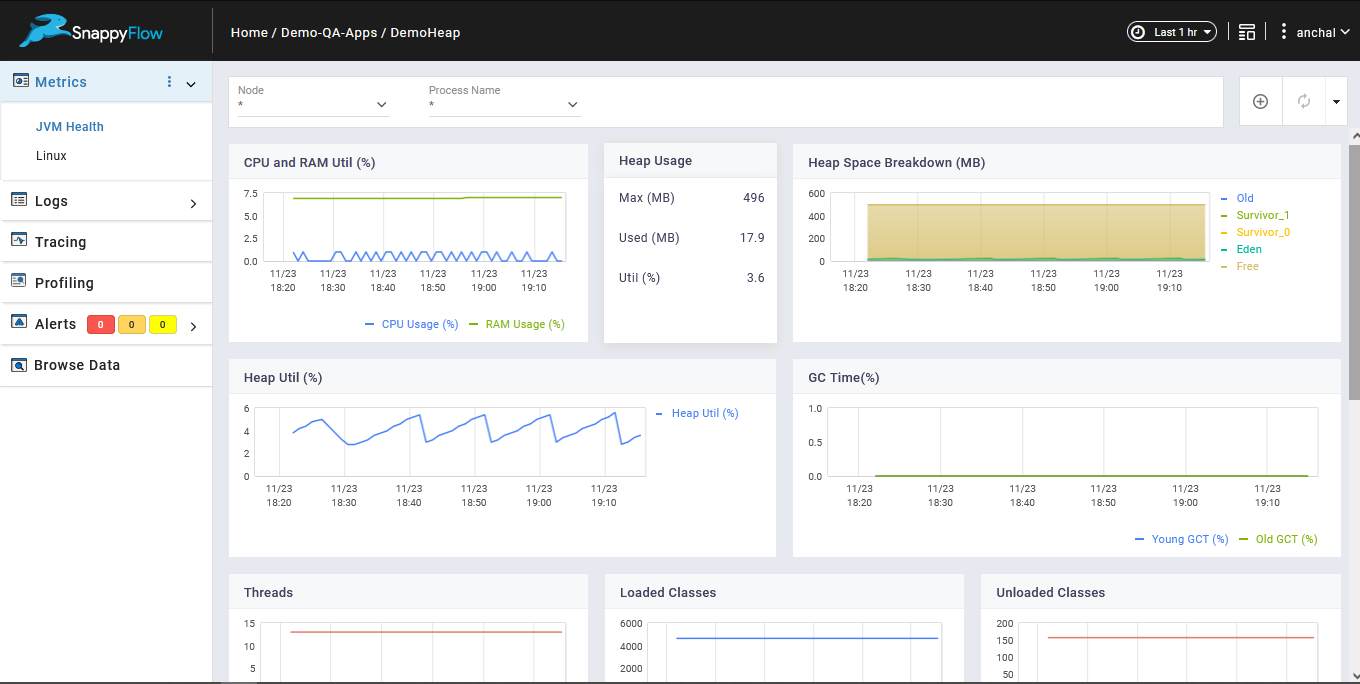
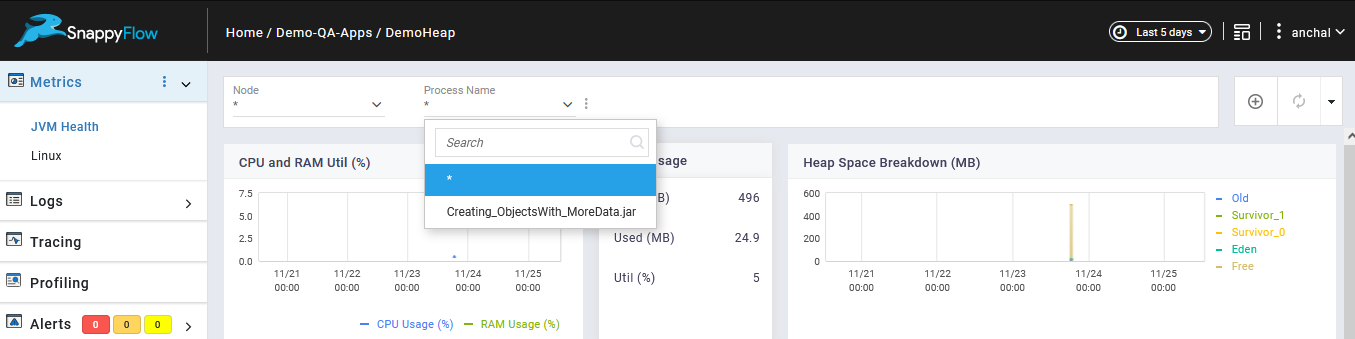
Dashboard
You can filter the process name.
Profiling >> Reports >> Select the filters from the options.
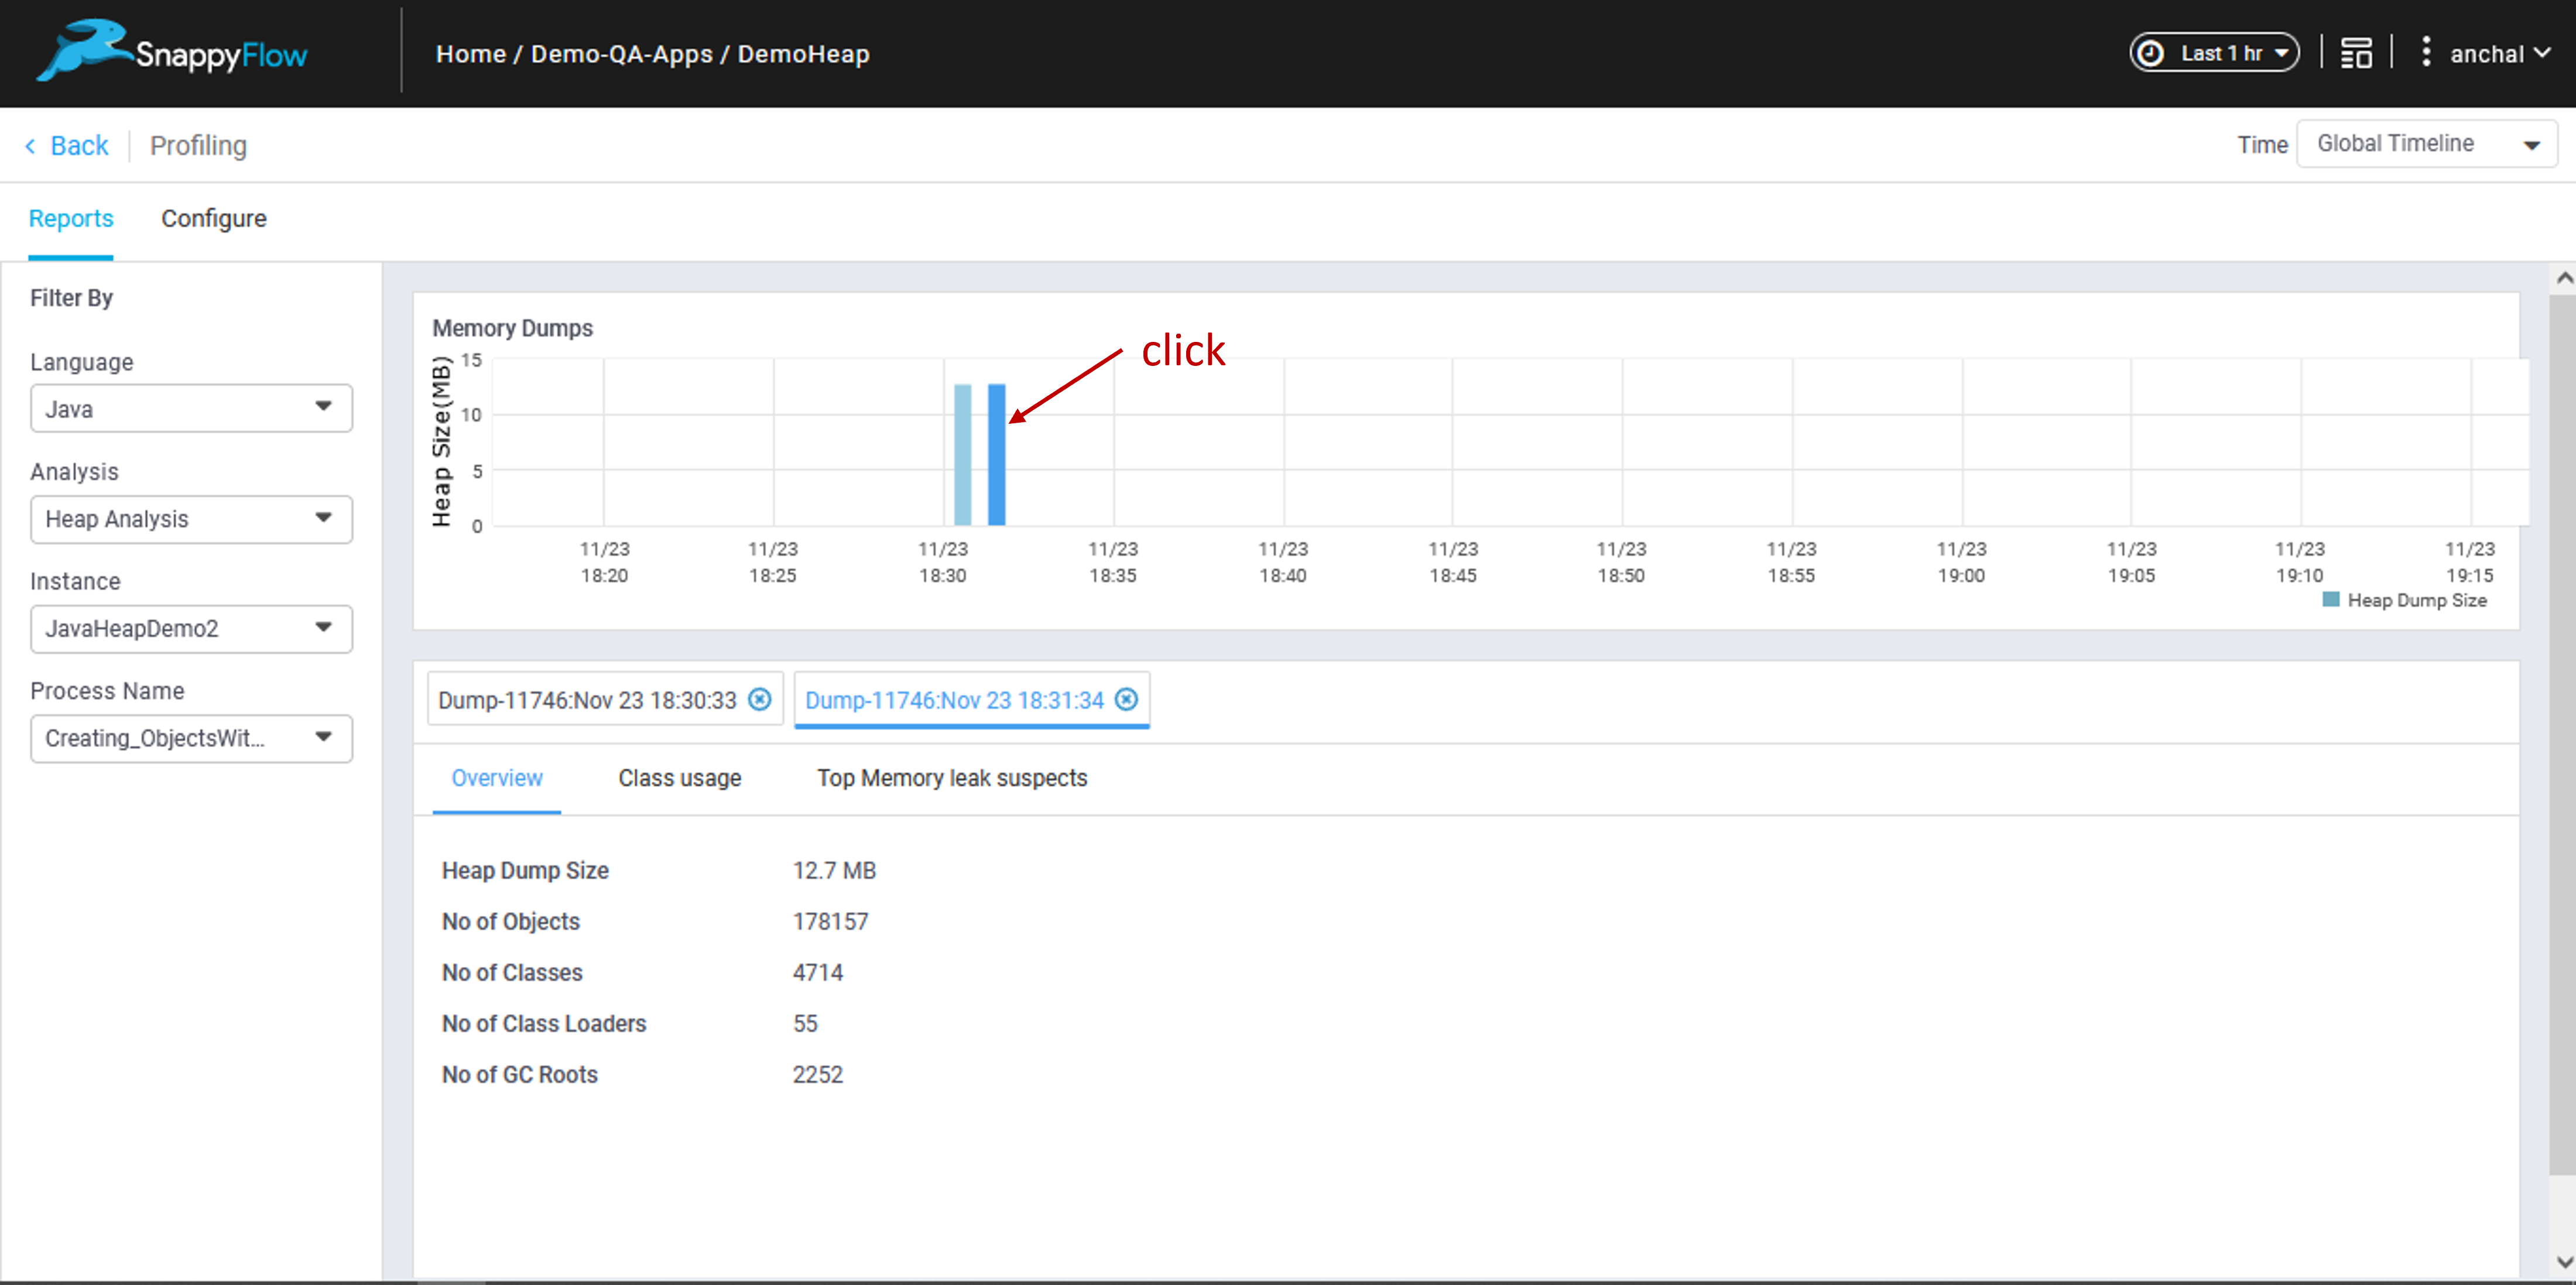
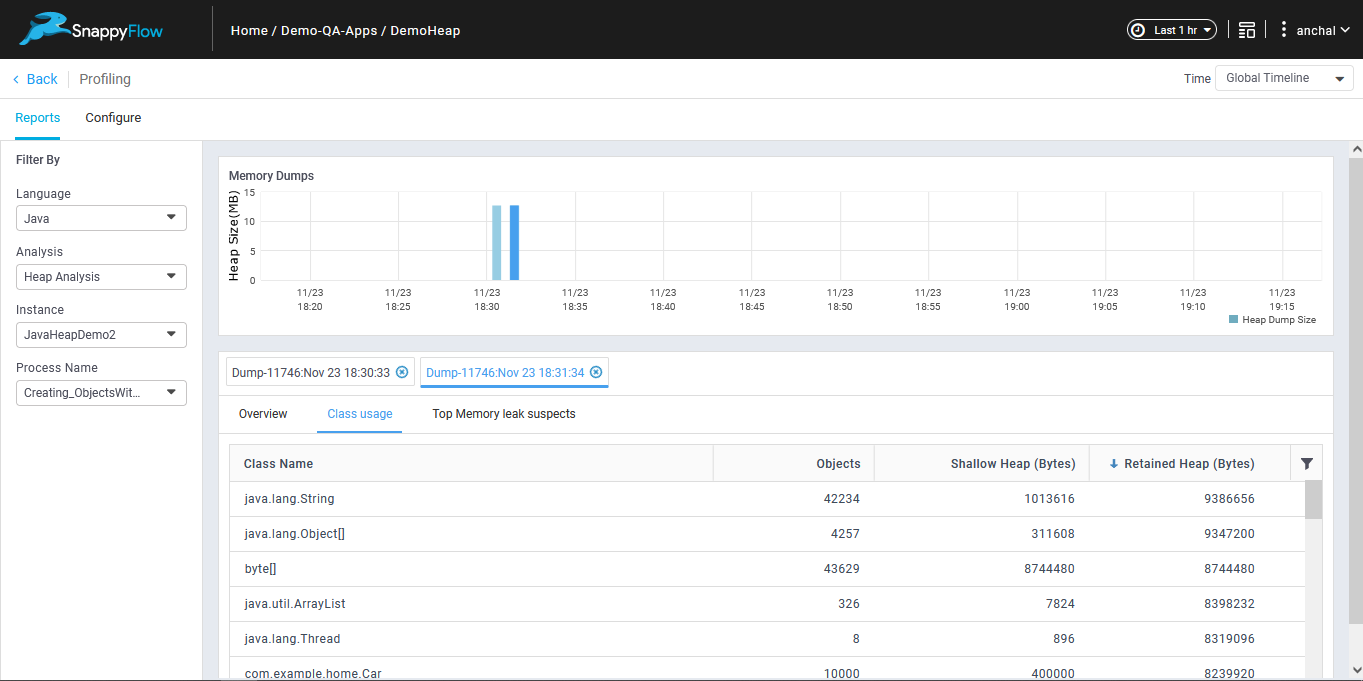
Click any heap dump in the graph to see the overview of it.
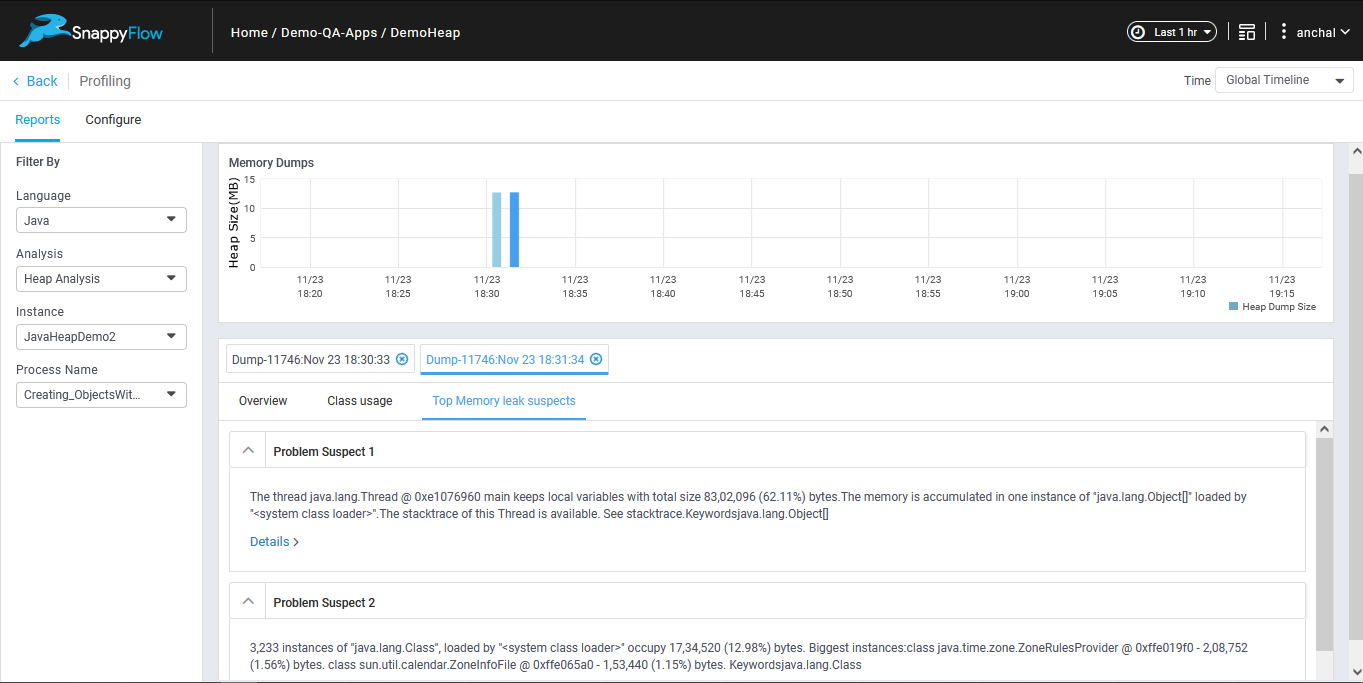
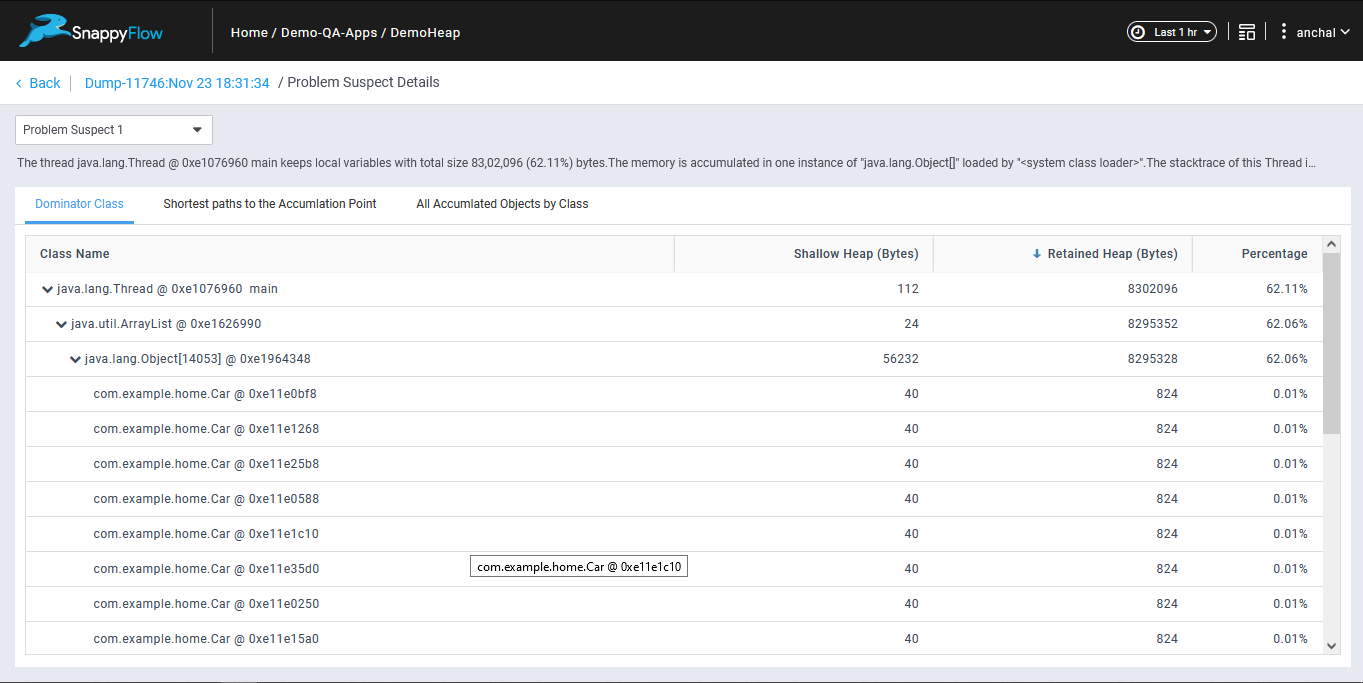
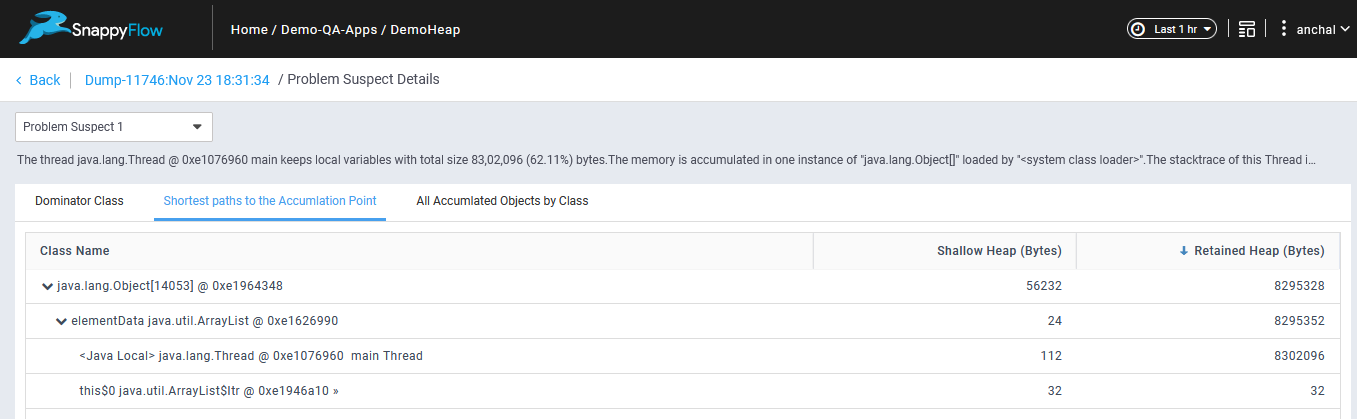
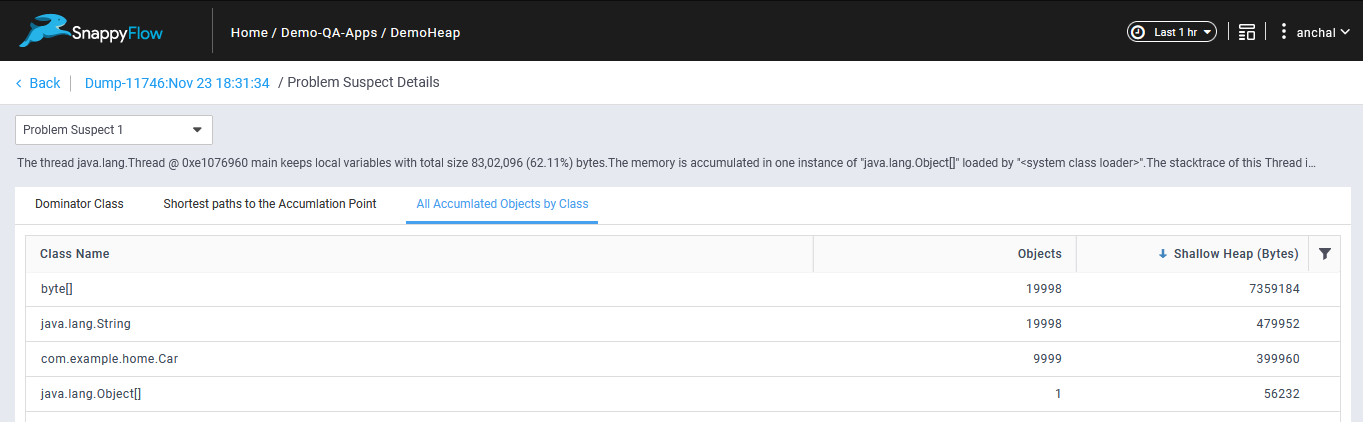
Top Memory leak suspects >> Details
Note
- User can tag the instances with user defined tags.
- Application : Grouping the instances performing a similar role/purpose (say web service) with user defined tags.
tags:
  Name: Custom_log_parser_Test
  appName: Custom_log_parser_Test
  projectName: Demo-QA-Apps
  serviceName: MyService    # user defined tags