Fargate Type
Deploy the snappyflow agent to collect the application metrics
To collect the jvm metrics for fargate type follow the below steps
Add the new container in the existing task definition where your application container is running.
Follow the below Steps to add the sfagent container
a. Go to the task definitions in ECS page
b. Select your task definition
c. Click on the new revision, under the container definitions select the add container. It will open the add container window.
provide the container name.
in the image field provide the sfagent image snappyflowml/sfagent:latest.
under the environment section add the below command in command text box.
sh,-c,apt-get update && apt-get upgrade -y && apt-get install -y wget && wget https://raw.githubusercontent.com/Sai-Devireddy-ML/configMap/main/config.yaml -O /opt/sfagent/config.yaml && /app/sfagent -enable-console-logyou need to place the config file in the git repository and update that repository information in the above command .
Below is the config information required to add in the config.yaml
key: <<profile key>>
tags:
 name: <<instance name>>
 appName: <<appname>>
 projectName: <<projectname>>
metrics:
plugins:
 name: jvmjolokia
  enabled: true
  interval: 60
  config:
    ip: 127.0.0.1
    protocol: http
    port: 8778
    context: jolokia
    monitorDeadlocks: false
    deadLockMonitoringInterval: 300
click on create.
After creating the new container, you need to attach the jolokia jar in the application container. To attach the jolokia jar follow the below steps.
- Click on the application container, it will open the edit container window.
- Under the port mappings enable the port is 8778, where jolokia jar is running.
- Under the environment section, edit the command field and add the below highlighted configuration for existing command.
mkdir /sfagent && wget -O /sfagent/sftrace-agent.tar.gz https://github.com/snappyflow/apm-agent/releases/download/latest/sftrace-agent.tar.gz && wget -O /sfagent/jolokia-jvm-1.6.2-agent.jar https://repo1.maven.org/maven2/org/jolokia/jolokia-jvm/1.6.2/jolokia-jvm-1.6.2-agent.jar && cd /sfagent && tar -xvzf sftrace-agent.tar.gz && java -javaagent:/sfagent/sftrace/java/sftrace-java-agent.jar -javaagent:/sfagent/jolokia-jvm-1.6.2-agent.jar=host=0.0.0.0 ${JMX_OPTS} -jar /app.jar- wget -O /sfagent/jolokia-jvm-1.6.2-agent.jar https://repo1.maven.org/maven2/org/jolokia/jolokia-jvm/1.6.2/jolokia-jvm-1.6.2-agent.jar this command is used for download the jolokia jar and will place under the sfagent folder.
- javaagent:/sfagent/jolokia-jvm-1.6.2-agent.jar=host=0.0.0.0 ${JMX_OPTS} this command is used for attaching the jolokia jar while running the application.
Add the below property under the environment variable
Key Value JMX_OPTS -Dcom.sun.management.jmxremote -Djava.rmi.server.hostname=127.0.0.1 -Dcom.sun.management.jmxremote.local.only=false -Dcom.sun.management.jmxremote.port=5555 -Dcom.sun.management.jmxremote.rmi.port=5555 -Dcom.sun.management.jmxremote.authenticate=false -Dcom.sun.management.jmxremote.ssl=false ELASTIC_APM_TRANSACTION_IGNORE_URLS /jolokia/* 
Click on update, it will close the application container page.
Click on create, it will create the new revision for the task definition.
Once the new revision is completed, follow the below steps to update your service in the cluster.
- Navigate to the cluster.
- Select the cluster
- Select the service
- Click on the update service, it will open the update service page
- Under the configure service select the task definition with latest revision
- Click on the force new deployment
- Click on the next step and finally click on the update service.
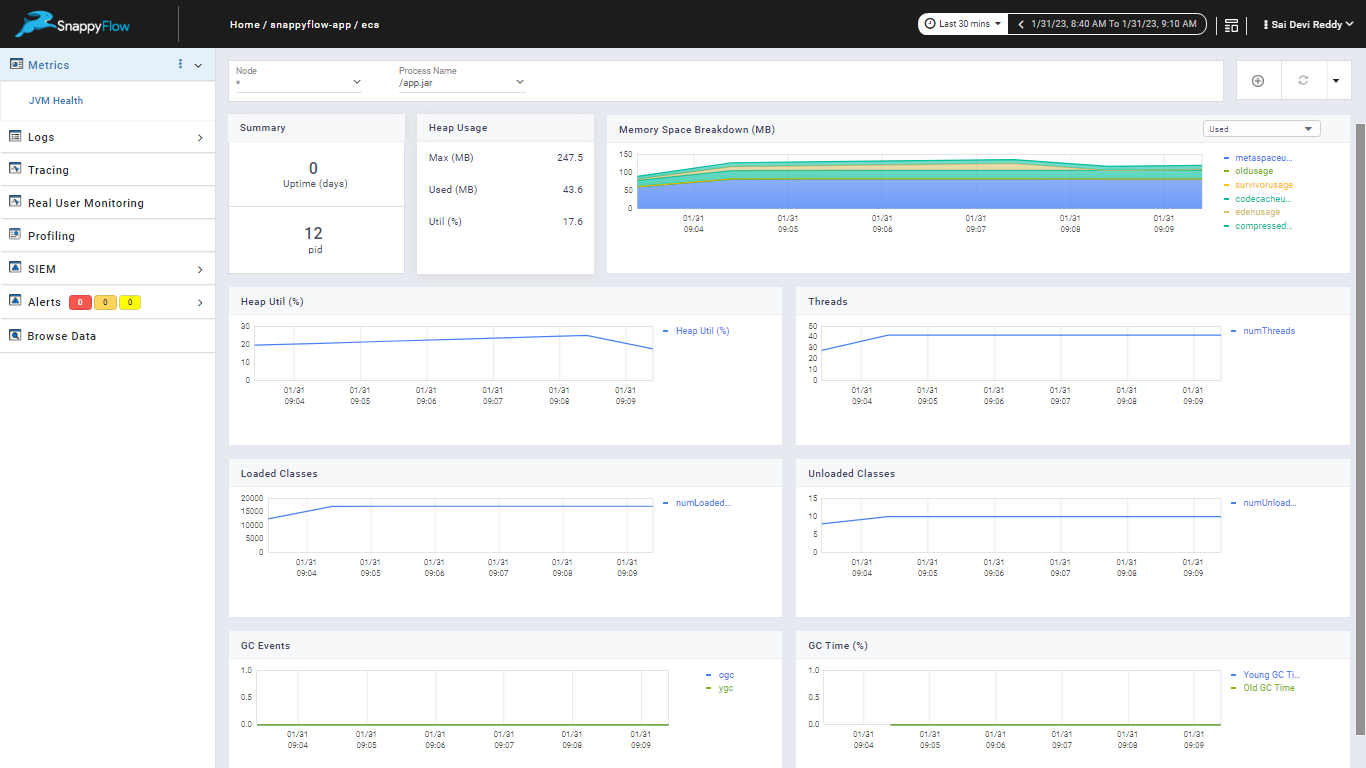
- Once the tasks are running under the service, you can see the service discovery and jvm metrics in the snappyflow APM