Monitor Aurora-MySQL DB
Prerequisites
Ensure that both the project and application are created within sfPoller. If they have not been created yet, you can click here to learn how to create a project and application in sfPoller.
Configure sfPoller to Collect Metrics
Follow the below step to add endpoints and plugins:
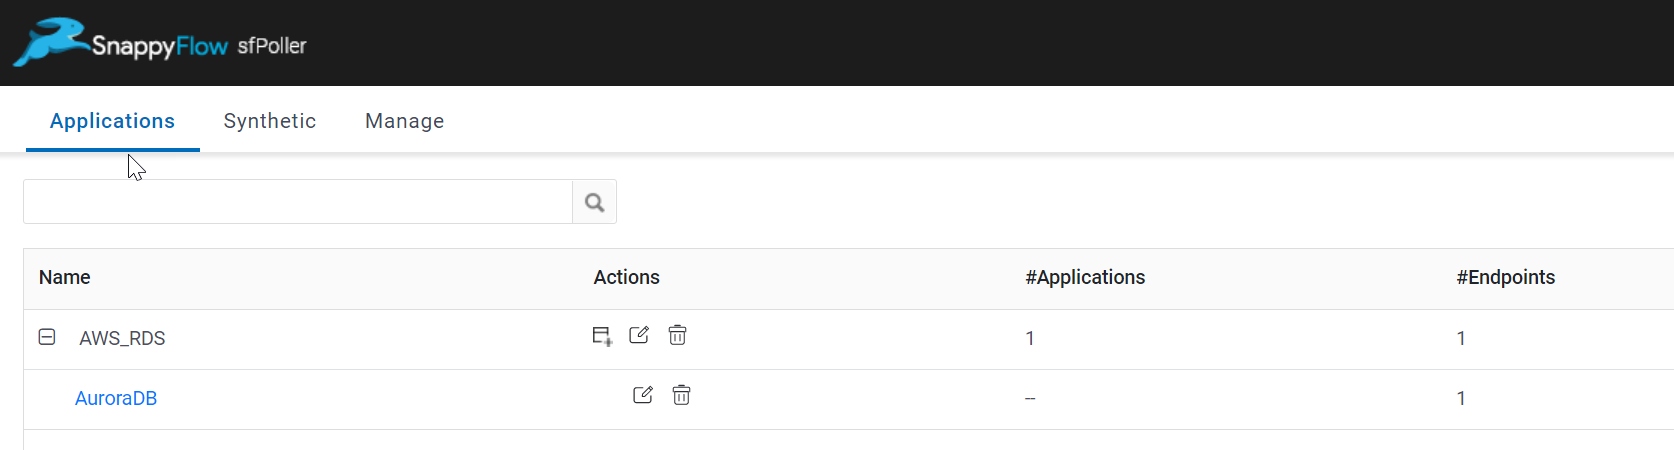
In the Application tab of sfPoller, navigate to your Project > Application.
Click on the Application, it will take you to the
Endpointpage.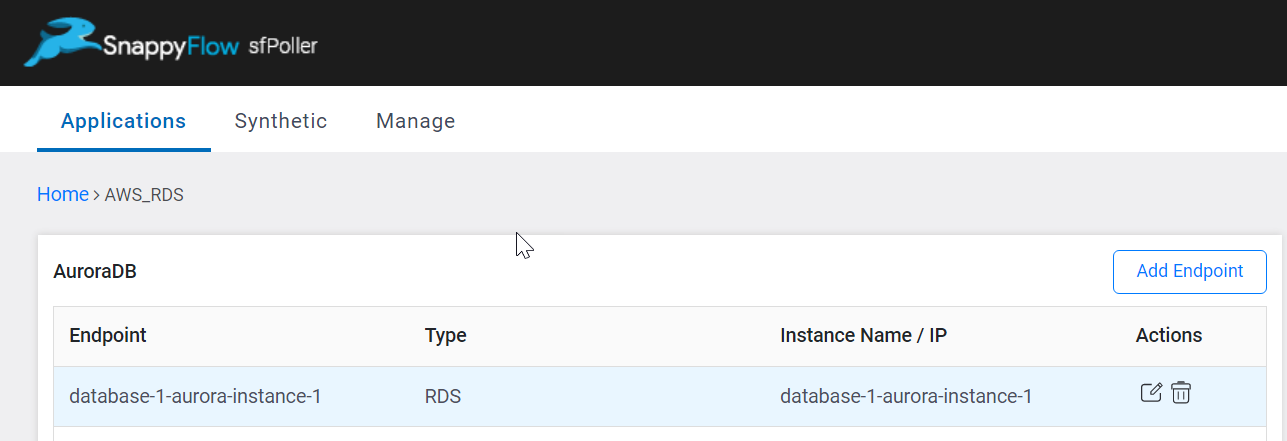
Click the
Add Endpointbutton, add the following data, and save.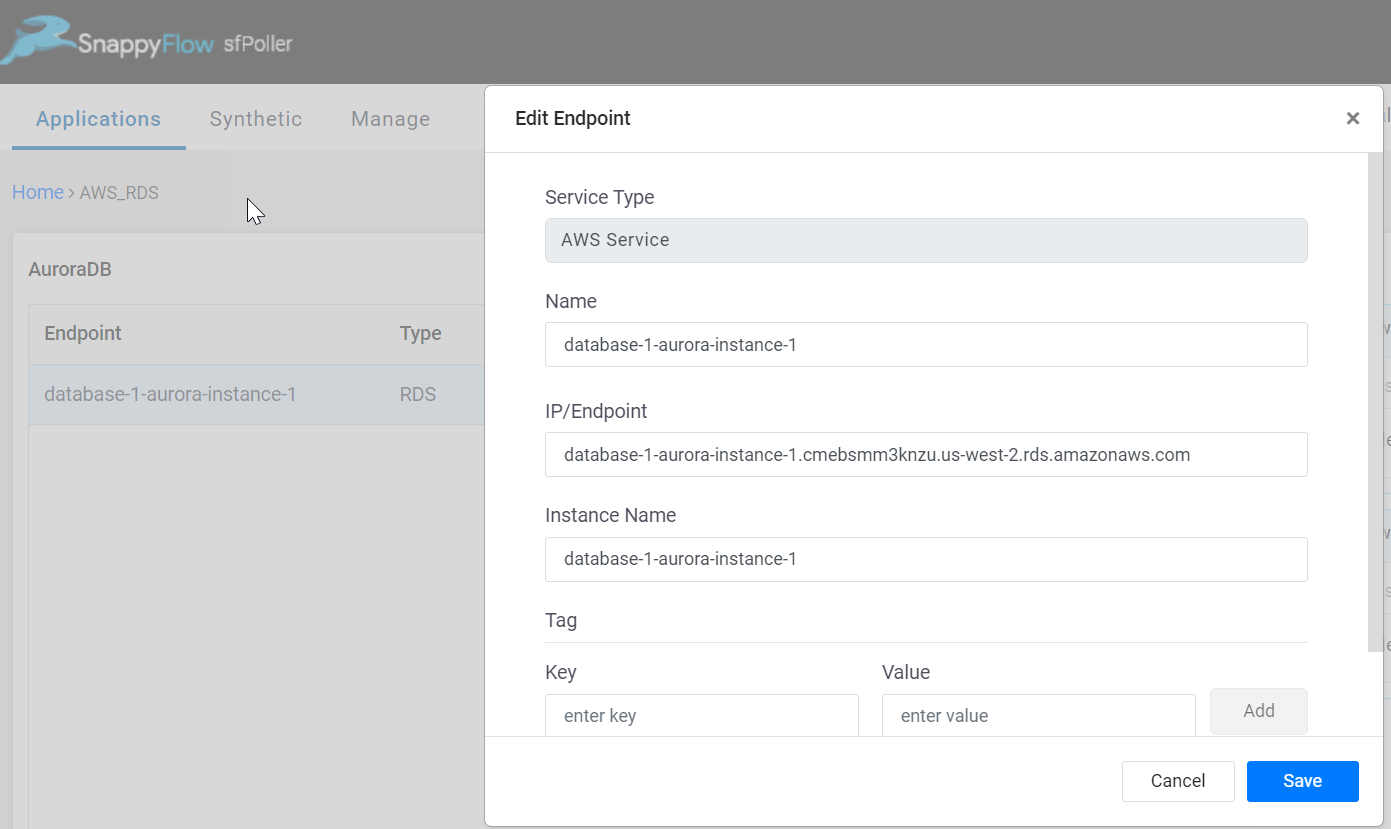
Service Type: Select AWS Service
Name: Give a meaningful name to the endpoint
IP/Endpoint: Add the application IP
Instance Name: Give the Instance name of your application
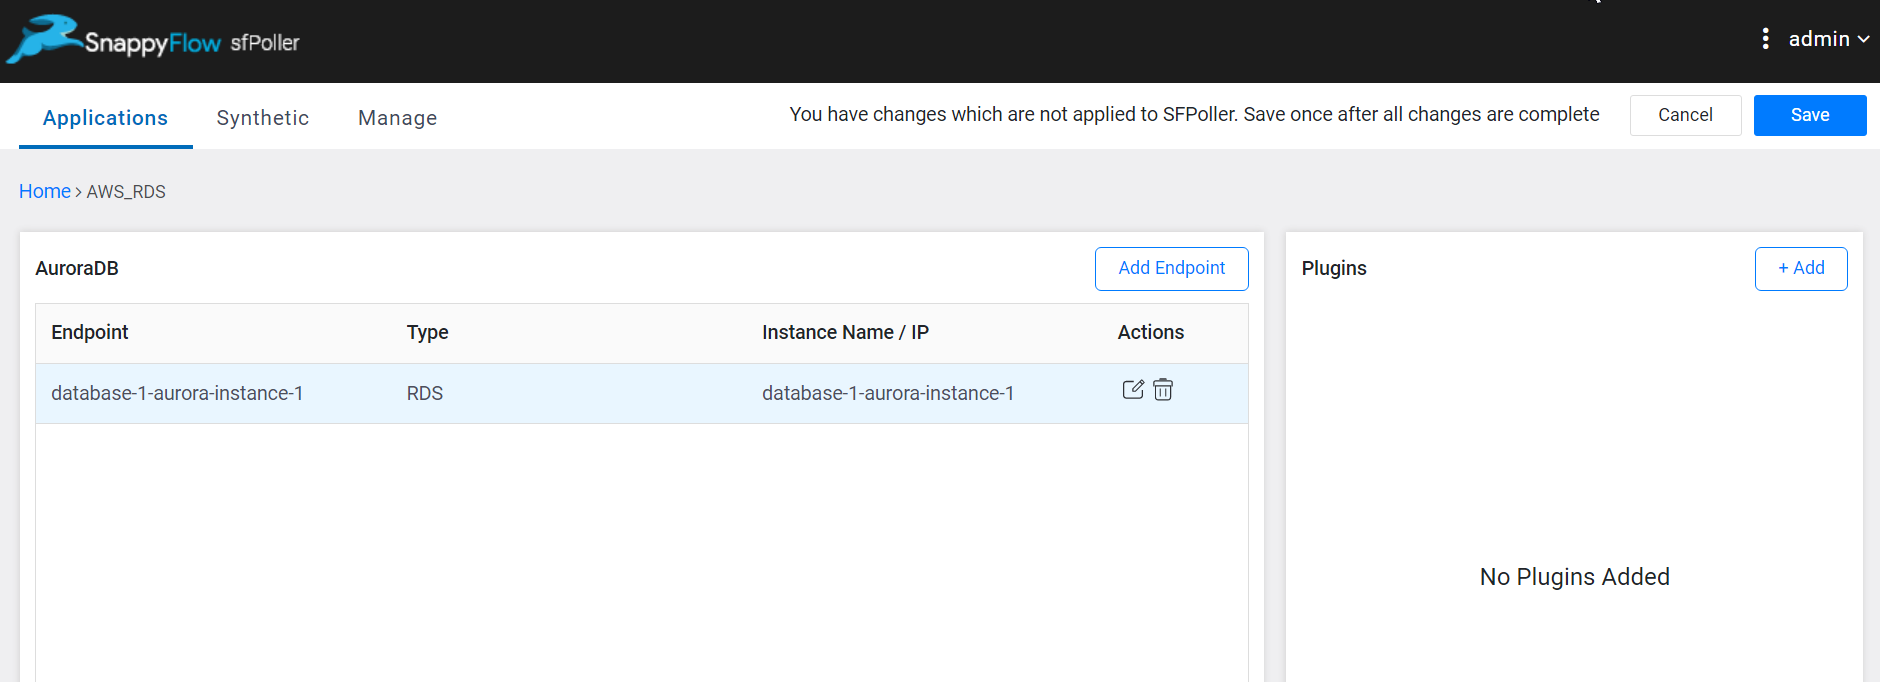
In the Plugins window, click the
+Addbutton.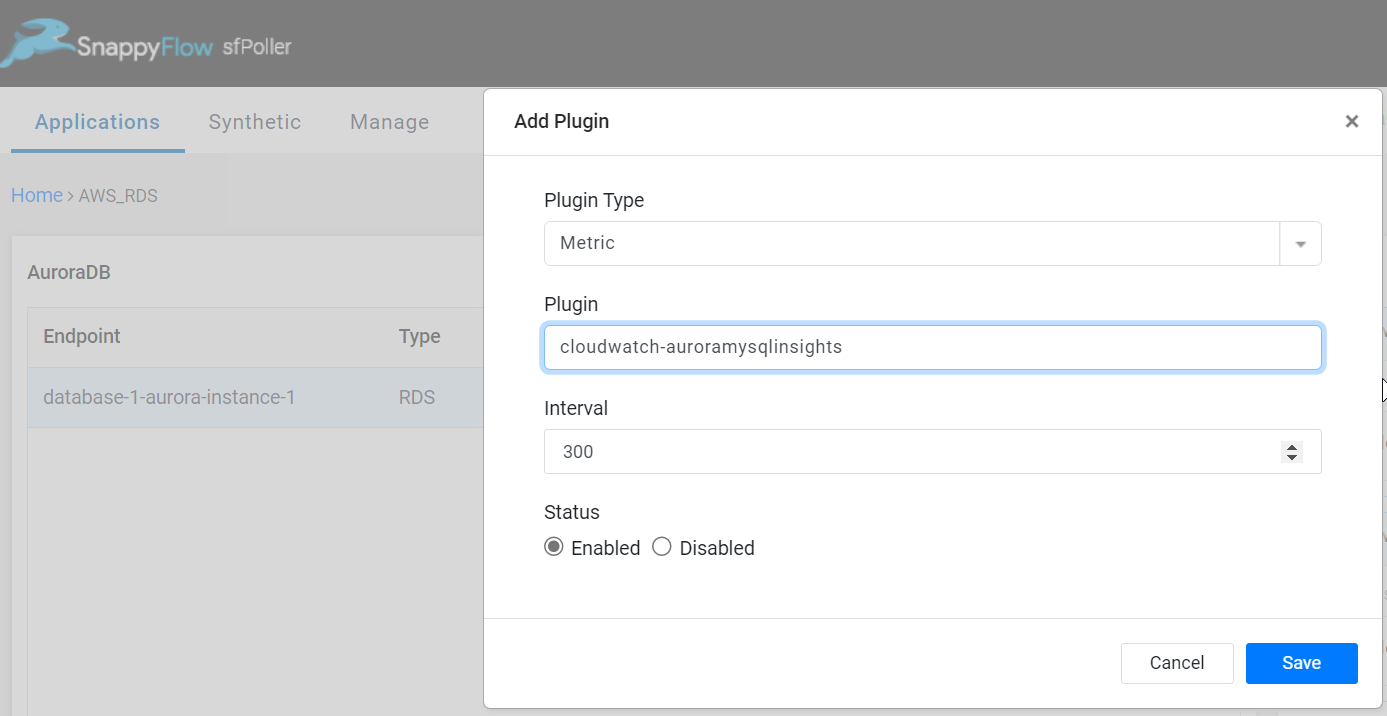
In the Add Plugin window, select the below details and save.
Plugin Type:
MetricPlugin:
cloudwatch-auroraorcloudwatch-auroramysqlinsightsInterval: Choose an interval value. The minimum value for the interval is 300
Status: By default, the status is
Enabled
Click the global
Savebutton in the window's top right corner to save all the changes made so far.
View Database Metrics and Logs
Follow the below steps to view the metrics collected from Aurora DB.
Go to the Application tab in SnappyFlow and navigate to your Project > Application > Dashboard.
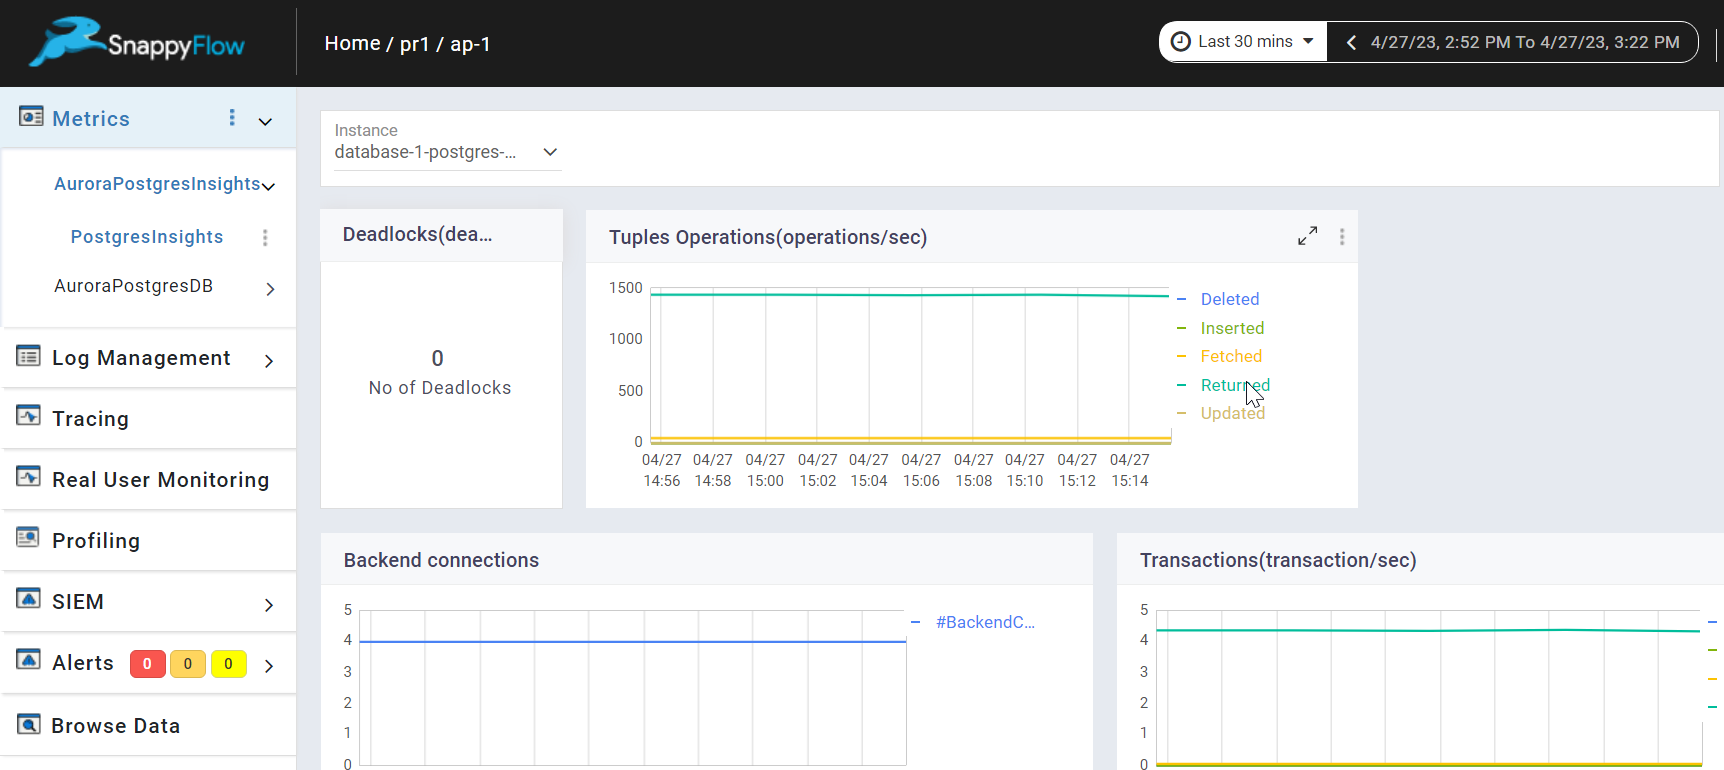
You can view the database metrics in the Metrics section.
Once plugins are added to sfPoller, they will be automatically detected within the Metrics section. However, if the plugins are not detected, you can import templates to view the corresponding metrics.
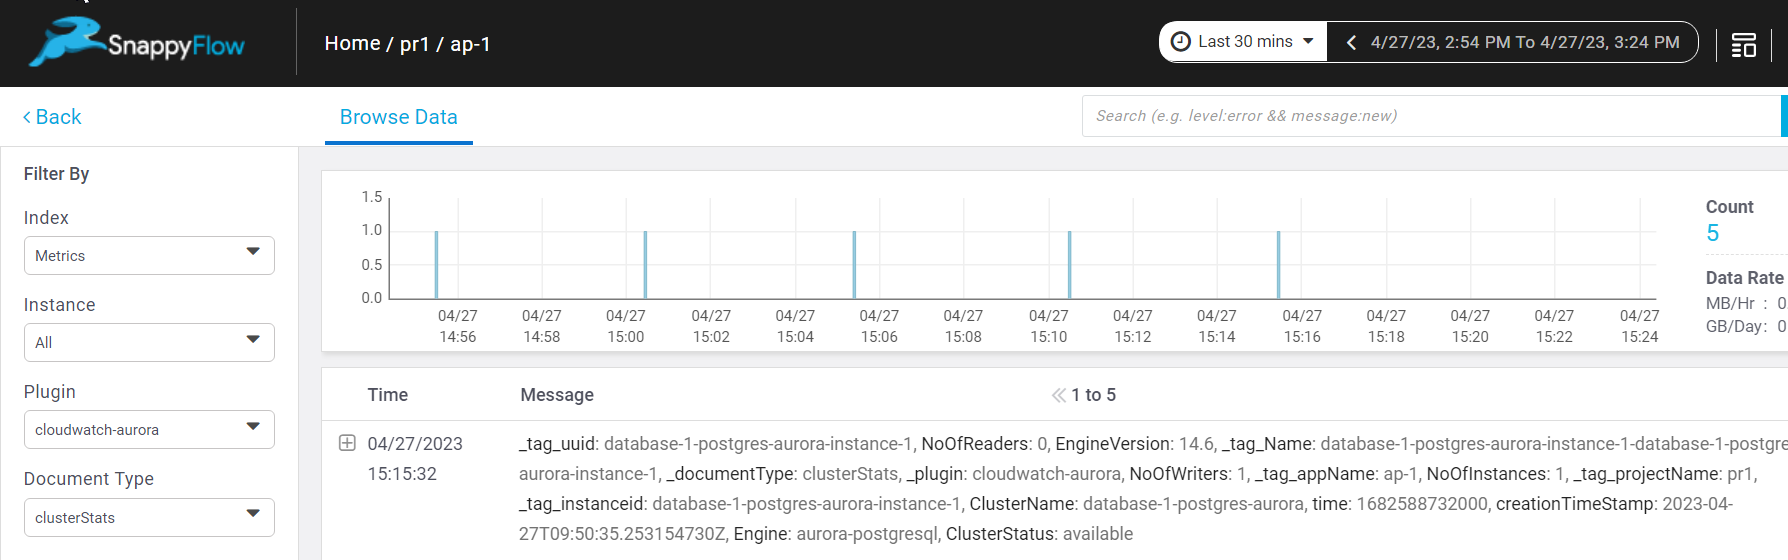
- To access the unprocessed data gathered from the plugins, navigate to the Browse data section and choose the
Index: Metric,Instance: Endpoint,Plugin,andDocument Type.
Template Details
| Template | Plugin | Document Type | Description |
|---|---|---|---|
| Aurora | cloudwatch-aurora | InstanceStats, ClusterStats | Monitors AWS AuroraDB instance to collect all the cluster-level and instance-level metrics. |
| Aurora_MYSQL_Insights | cloudwatch-auroramysqlinsights | RDSauroramysqlDetails | Monitors AWS Aurora MySql DB to collect both native and non-native MySql metrics. |
Metric List
Aurora-mysql InstanceStats
| Metric | Description |
|---|---|
| RowLockTime | The total time spent acquiring row locks for InnoDB tables. |
| SelectLatency | The average amount of time for select operations. |
| LoginFailures | The average number of failed login attempts per second. |
| InsertThroughput | The average number of insert operations per second. |
| InsertLatency | The average duration of insert operations. |
| DMLThroughput | The average number of inserts, updates, and deletes per second. |
| DMLLatency | The average duration of inserts, updates, and deletes. |
| DeleteThroughput | The average number of deleted queries per second. |
| DeleteLatency | The average duration of delete operations. |
| DDLThroughput | The average number of DDL requests per second. |
| DDLLatency | The average duration of requests such as example, create, alter, and drop requests. |
| BlockedTransactions | The average number of transactions in the database that are blocked per second. |
| AuroraBinlogReplicaLag | The amount of time that a binary log replica DB cluster running on Aurora MySQL-Compatible Edition lags behind the binary log replication source. |
| UpdateThroughput | The average number of updates per second. |
| StorageNetworkTransmitThroughput | The amount of network throughput received from the Aurora storage subsystem by each instance in the DB cluster. |
| StorageNetworkReceiveThroughput | The amount of network throughput received from the Aurora storage subsystem by each instance in the DB cluster. |
| SwapUsage | The amount of swap space used. This metric is available for the Aurora MySQL DB instance. |
| FreeableMemory | The amount of available random access memory, in bytes. |
| FreeLocalStorage | This metric reports the amount of storage available to each instance for temporary tables and logs. |
| Deadlocks | The average number of deadlocks in the database per second. |
| ReadLatency | The average amount of time taken per disk I/O operation. |
| CPUUtilization | The percentage of CPU used by an instance. |
| DatabaseConnections | The number of client network connections to the database instance. |
| CommitThroughput | The average number of commit operations per second. |
| CommitLatency | The average duration of commit operations. |
| EngineUptime | The amount of time that the instance has been running. |
cloudwatch-auroramysqlinsights:
| Metric | Description |
|---|---|
| db.SQL.Com_select | no of select statements executed. |
| db.SQL.Innodb_rows_deleted | The number of rows deleted from InnoDB tables. |
| db.SQL.Innodb_rows_inserted | The number of rows inserted into InnoDB tables. |
| db.SQL.Innodb_rows_read | The number of rows read into InnoDB tables. |
| db.SQL.Innodb_rows_updated | The number of rows updated into InnoDB tables. |
| db.SQL.Questions | The number of statements executed by the server. |
| db.Users.Aborted_clients | The number of connections that were aborted because the client died without closing the connection properly. |
| db.Users.Aborted_connects | The number of failed attempts to connect to the MySQL server. |
| db.Users.Threads_created | The number of threads created to handle connections. |
| db.Cache.innoDB_buffer_pool_hits | The number of reads that InnoDB could satisfy from the buffer pool. |
| db.Cache.innoDB_buffer_pool_hit_rate | The percentage of reads that InnoDB could satisfy from the buffer pool. |
| db.Cache.innoDB_buffer_pool_usage | The percentage of the InnoDB buffer pool that contains data (pages). |
| db.Cache.query_cache_hit_rate | The hit ratio for the MySQL result set cache (query cache). |
| db.SQL.innodb_rows_changed | The total InnoDB row operations |
| db.Transactions.active_transactions | The total active transactions. |
| db.Locks.innodb_deadlocks | The total number of deadlocks. |
| db.Locks.innodb_lock_timeouts | The total number of deadlocks that timed out. |