Monitor PgBouncer on Instance
Prerequisites
a. Install sfagent.Click here to install sfagent to the application environment.
b. Configure PgBouncer admin and stats user.Configure the pgbouncer user as admin and stats user by adding the below lines in the pgbouncer.ini config file.
The default location of the Pgbouncer configuration file is /etc/pgbouncer/pgbouncer.ini.
Execute the following command in the Pgbouncer configuration file.
admin_users = <username>

stats_users =  <username>
By default, PgBouncer allows only the parameters it can keep track of in the startup packets: client_encoding, datestyle, timezone, and standard_conforming_strings. All other parameters will raise an error. To allow other parameters, ignore startup parameters command is used.
Example: ignore_startup_parameters = extra_float_digits
Configuration
To initiate the monitoring of PgBouncer running on an instance, add the following configuration to the config.yaml file.
key: <profile key>
tags:
  Name: <unique instance name or will be generated from IP>
  appName: <add application name>
  projectName: <add project name>
metrics:
  plugins:
  - name: pgbouncer
    enabled: true
    interval: 30
    config:
      port: <port>
      host: <host/IP>
      user: <username>
      password: <password>
logging:
  plugins:
  - name: pgbouncer
    enabled: true
    config:
      log_path: "/var/log/postgresql/pgbouncer.log"
View Metrics and Logs
Follow the below steps to view metrics and logs collected from PgBouncer running on an instance.
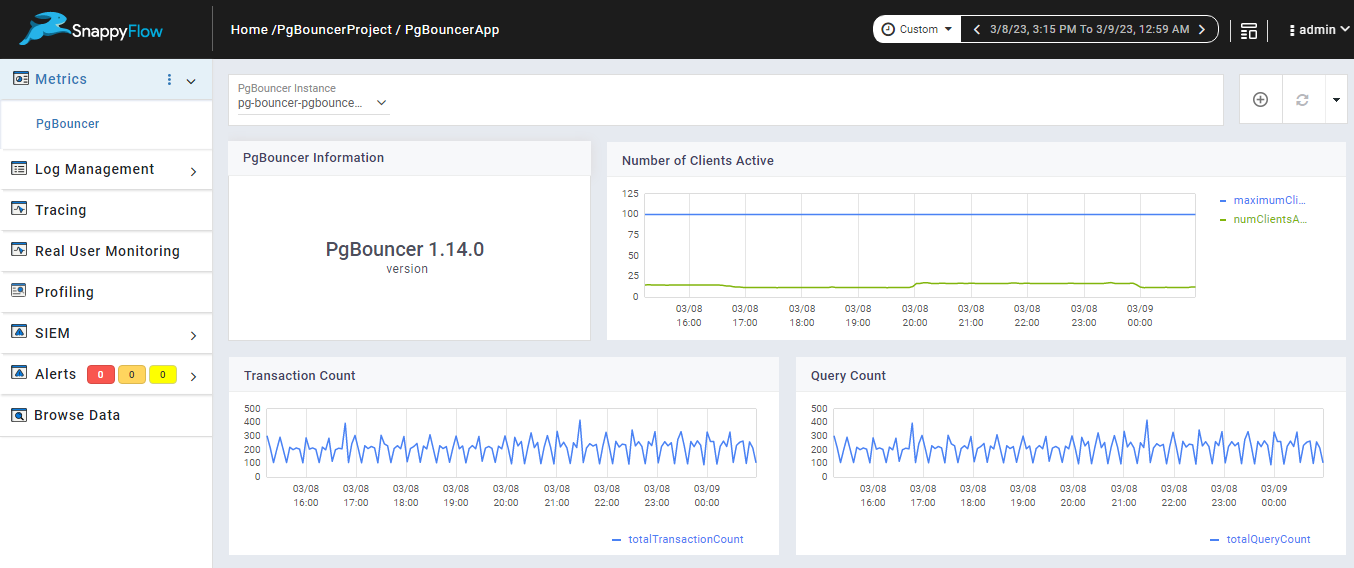
Go to the Application tab in SnappyFlow and navigate to your Project > Application > Dashboard
You can view the PgBouncer metrics in the Metrics section and logs in Log Management section.
Once the PgBouncer configuration settings are done, the PgBouncer plugin will be automatically detected within the Metrics section. However, if the plugin is not detected, you can import template = PgBouncer to view the corresponding metrics and logs.
- To access the unprocessed data gathered from the plugin, navigate to the Browse data section and choose the
Index: Metric or Logger,Instance: Endpoint,Plugin, andDocument Type.
Template Details
| Template | Plugin | Document Type |
|---|---|---|
| PgBouncer | PgBouncer | pgbouncerDetails, databaseStats, databasePools, pgbouncerLogs |
Metrics list
PgbouncerDetails
| Metric | Description |
|---|---|
| version | Current Version of the PgBouncer |
| numServerActive | Total server connections that are linked to a client. |
| numServerUsed | Total server connections that have been idle for more than server_check_delay, so they need server_check_query to run on them before they can be used again. |
| numServerIdle | Server connections that are unused and immediately usable for client queries. |
| numServerLogin | Server connections currently in the process of logging in. |
| numServerTested | Server connections that are currently running either server_reset_query or server_check_query |
| numClientsActive | Server connections that are linked to a client. |
| numClientsWait | Client connections that have sent queries but have not yet got a server connection. |
| maximumClientConn | Maximum number of clients that can connect to PgBouncer |
| totalTransactionCount | Total number of SQL transactions pooled by pgbouncer. |
| totalQueryCount | Total number of SQL queries pooled by pgbouncer. |
| totalRecievedBytes | Total volume in bytes of network traffic received by pgbouncer. |
| totalSentBytes | Total volume in bytes of network traffic sent by pgbouncer. |
| averageTransactionCountPerSecond | Average transactions per second in last stat period. |
| averageQueryCountPerSecond | Average queries per second in last stat period. |
| averageSentBytesPerSecond | Average sent (to clients) bytes per second. |
| averageRecievedBytesPerSecond | Average received (from clients) bytes per second. |
Database Stats
| Metric | Description |
|---|---|
| databaseName | Statistics are presented per database. |
| totalTransactionTimeMicroseconds | Total number of microseconds spent by pgbouncer when connected to PostgreSQL in a transaction, either idle in transaction or executing queries. |
| averageTransactionTimeMicroseconds | Average transactions per second in last stat period. |
| totalRecievedBytes | Total volume in bytes of network traffic received by pgbouncer. |
| averageTransactionCountPerSecond | Average transactions per second in last stat period. |
| averageRecievedBytesPerSecond | Average received (from clients) bytes per second. |
| totalTransactionCount | Total number of SQL transactions pooled by pgbouncer. |
| averageWaitTimeMicroseconds | Average time spent by clients waiting for a server that were assigned a backend connection within the current stats_period, in microseconds (averaged per second within that period). |
| totalWaitTimeMicroseconds | Time spent by clients waiting for a server, in microseconds. Updated when a client connection is assigned a backend connection. |
| averageQueryTimeMicroseconds | Average query duration, in microseconds. |
| totalQueryCount | Total number of SQL queries pooled by pgbouncer. |
| averageQueryCountPerSecond | Average queries per second in last stat period. |
| averageSentBytesPerSecond | Average sent (to clients) bytes per second. |
| totalSentBytes | Total volume in bytes of network traffic sent by pgbouncer. |
| totalQueryTimeMicroseconds | Total number of microseconds spent by pgbouncer when actively connected to PostgreSQL, executing queries. |
Database Pools
| Metric | Description |
|---|---|
| user | User name |
| databaseName | Database name |
| numServerActive | Server connections that are linked to a client. |
| numServerUsed | Server connections that have been idle for more than server_check_delay, so they need server_check_query to run on them before they can be used again. |
| numServerIdle | Server connections that are unused and immediately usable for client queries. |
| numServerLogin | Server connections currently in the process of logging in. |
| numServerTested | Server connections that are currently running either server_reset_query or server_check_query |
| numClientsActive | Server connections that are linked to a client. |
| numClientsWait | Client connections that have sent queries but have not yet got a server connection. |
| maximumWaitTimeinSeconds | Maximum wait time of the first (oldest) client in the queue has waited, in seconds |
| maximumWaitMicroseconds | Microsecond part of the maximum waiting time. |
| poolMode | The pooling mode in use. |