Monitor Java Application in ECS
Deployment - Fargate
Deploying the SnappyFlow trace agent
Do the below steps in the current task definition within the docker container of the application.
Go to the task definitions in the ECS page.
Select the task definition.
Click on create new revision.
Choose the container definition for the Docker container running the application, and the edit container window will open.
Add the below details under the environment section of the edit container window.
- In the entry point text box provided the
sh,-c - In the command text box add the below command which is highlighted
mkdir /sfagent && wget -O /sfagent/sftrace-agent.tar.gz https://github.com/snappyflow/apm-agent/releases/download/latest/sftrace-agent.tar.gz && cd /sfagent && tar -xvzf sftrace-agent.tar.gz && java -javaagent:/sfagent/sftrace/java/sftrace-java-agent.jar -jar applicationjarfile.jar- In the entry point text box provided the
Add the below mentioned environment variables these are required to send the trace data to the Snappyflow server.
noteMake sure that the project and the application are created in the Snappyflow before adding the environment variable.
Key Value ELASTIC_APM_USE_PATH_AS_TRANSACTION_NAME true ELASTIC.APM.CAPTURE_BODY all SFTRACE_APP_NAME APP_NAME SFTRACE_PROFILE_KEY Profile_key SFTRACE_PROJECT_NAME Project_Name SFTRACE_SERVICE_NAME Service_Name Click the update option to close the edit container pop up.
Click the create option to create the new revision for the task definition.
Once the new revision is completed, follow the below steps to update the service in the cluster.
- Navigate to the cluster and select the cluster and the service
- Click the update service, it will open the update service page
- Under the configure service select the task definition with latest revision
- Click the force new deployment and click next step
- Once the tasks are running under the service, trigger the request in the application
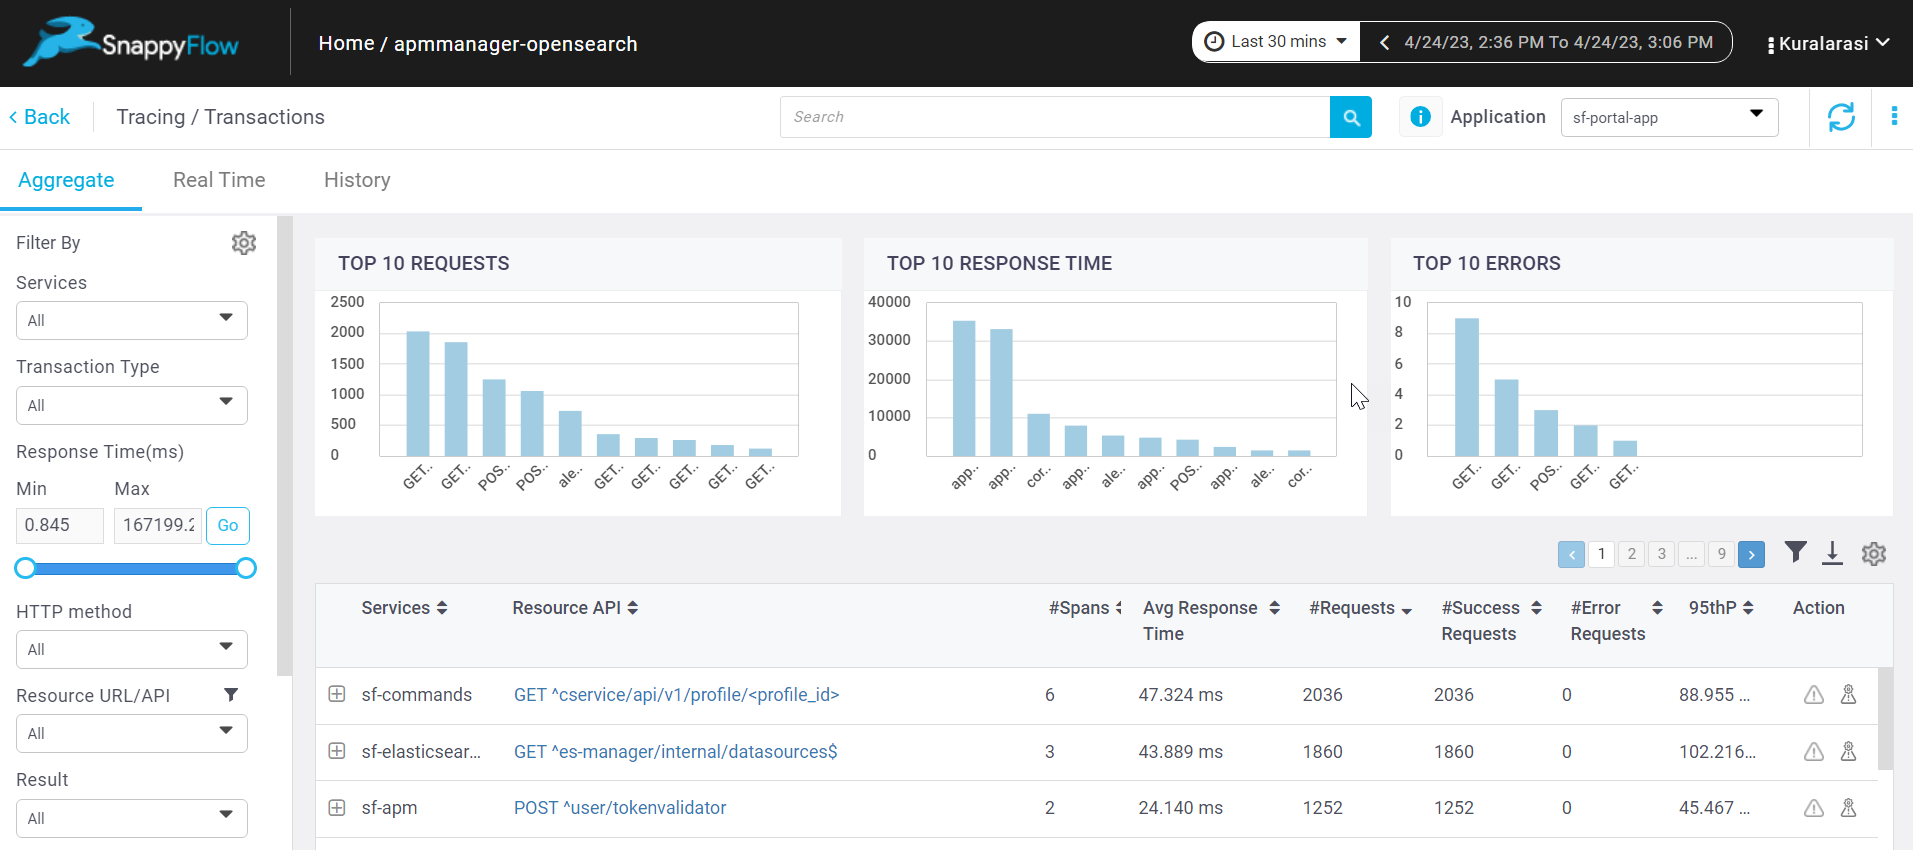
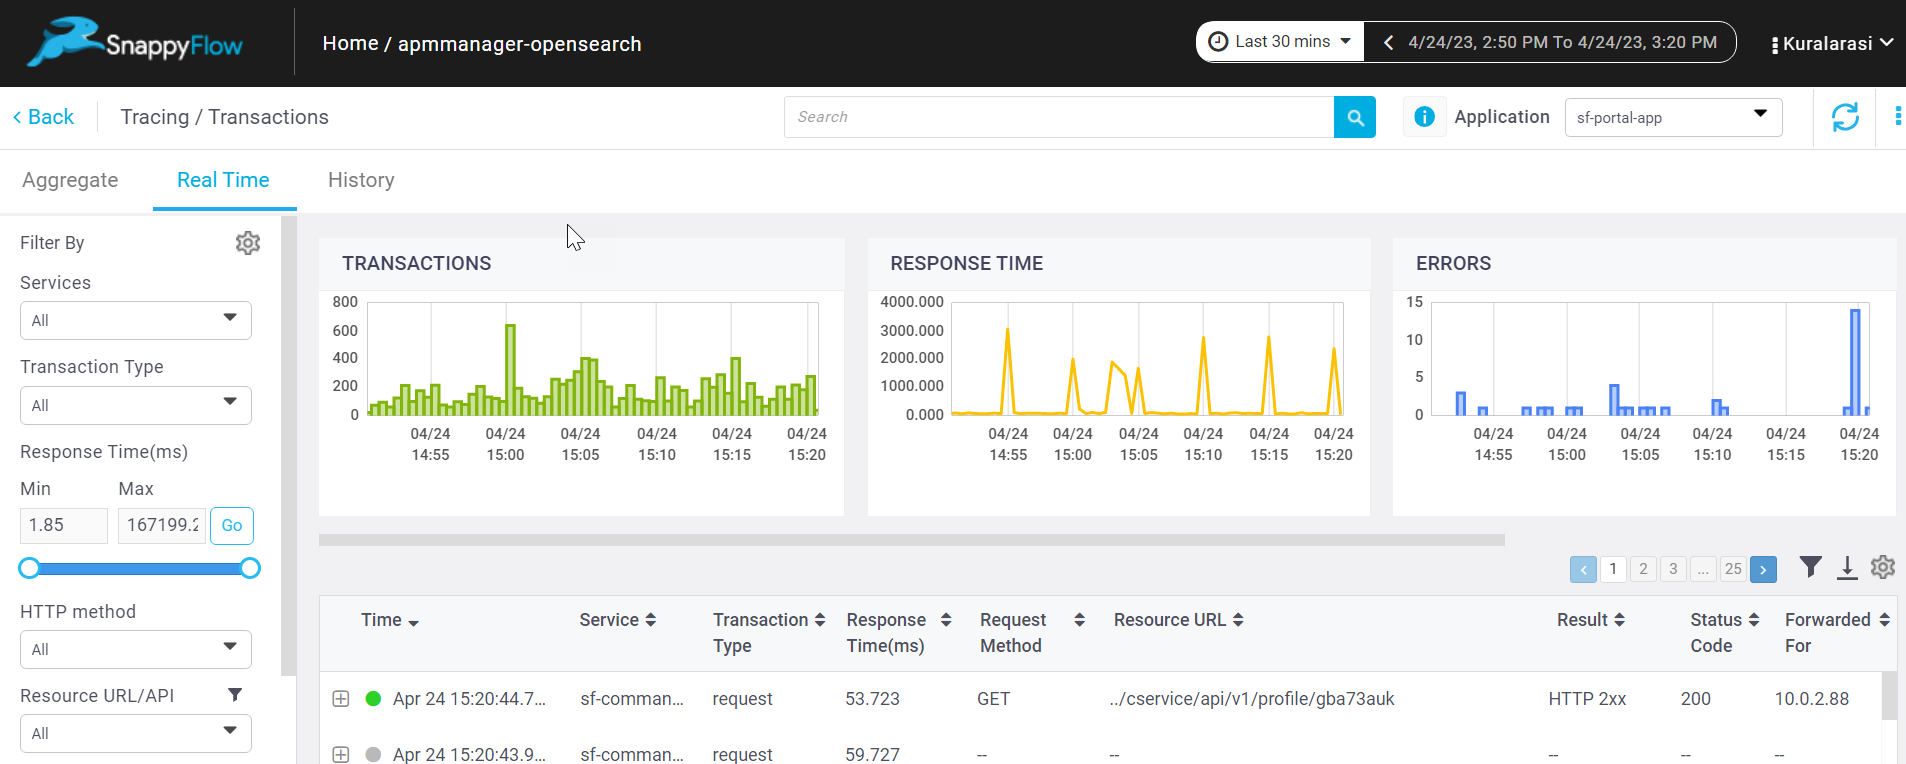
View Trace Data
Follow the below steps to view the trace data.
Go to the Application tab in SnappyFlow and navigate to your Project > Application > Dashboard.
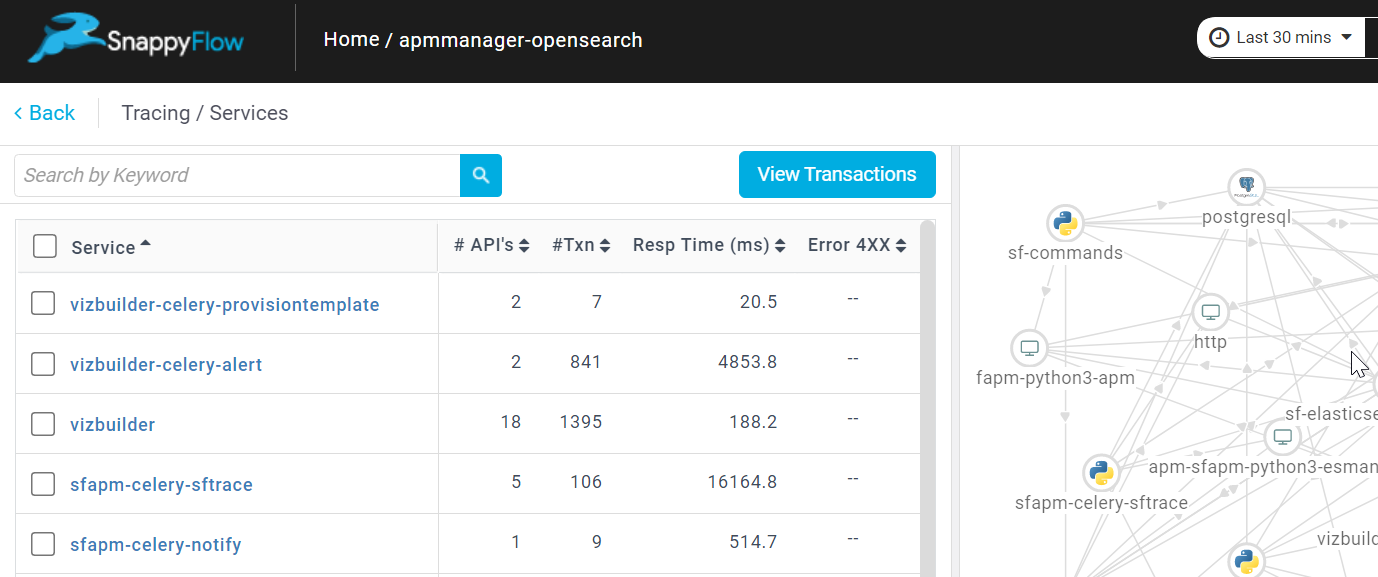
In the dashboard window, navigate to the Tracing section and click the
View Transactionsbutton.You can view the traces in the Aggregate and the Real Time tabs.