NodeJS tracing
The NodeJS tracing automatically instruments APIs, frameworks and application servers. The sfAPM trace agent collects and sends the tracing metrics and the correlated application logs to the SnappyFlow server.
Available Platforms
Supported Trace Features
Below is the list of the supported trace features:
- Distributed Tracing
- Transaction Mapping
- Log Correlation
- Capture request Body from Trace
- Service Map
The Log Correlation and Capture Request Body from Trace features are not enabled by default. Users need to add additional configurations.
Instances
Node.JS Express
Follow the below steps to enable the tracing for the application based on Node.JS Express.
Configuration
Install the below nodejs libraries using CLI.
npm install --save elastic-apm-node@^3.20.0
npm install --save sf-apm-lib@^1.0.2
or update the
package.jsonfile with following entries."elastic-apm-node": "^3.20.0"
"sf-apm-lib": "^1.0.2"and run the
npm installcommand in the CLI to install dependencies.If the sfAgent is already installed in your instance, the trace agent picks up the profileKey, projectName, and appName from the config.yaml file. Add the below entries in your application’s main file at starting of the file (usually
index.js,server.jsorapp.js).
i. Add the following source code to integrate the Express application to the SnappyFlow.
const Snappyflow = require('sf-apm-lib');
// Initialize Snappyflow. By default intialization will take profileKey, projectName and appName from sfagent config.yaml.
var sfObj = new Snappyflow();
let sfTraceConfig = sfObj.getTraceConfig();
var apm;
try {
   apm = require('elastic-apm-node').start({
         // Specify your service name for tracing.
         serviceName: 'node-trace',
         serverUrl: sfTraceConfig['SFTRACE_SERVER_URL'],
         globalLabels: sfTraceConfig['SFTRACE_GLOBAL_LABELS'],
         verifyServerCert: sfTraceConfig['SFTRACE_VERIFY_SERVER_CERT'] === undefined ? false : sfTraceConfig['SFTRACE_VERIFY_SERVER_CERT'],
         active: sfTraceConfig['SFTRACE_SERVER_URL'] === undefined ? false : true,
         stackTraceLimit: sfTraceConfig['SFTRACE_STACK_TRACE_LIMIT'],
         captureSpanStackTraces: sfTraceConfig['SFTRACE_CAPTURE_SPAN_STACK_TRACES'],
         metricsInterval: '0s',
         usePathAsTransactionName: true
    })
} catch (e) {
   console.log(e);
}
If the sfAgent is not installed in your instance, then follow the below steps:
i. Make sure the project and application is created in the SnappyFlow Server. Click Here to know how to create the project and application in SnappyFlow.
ii. ProvideSF_PROJECT_NAME,SF_APP_NAME,SF_PROFILE_KEYas an environment variable in.envfile. Follow the below steps to use custom environment variables in Node.Create an .env file, add the following variables. The file should be placed in the root of your project.
# Update the below default values with proper values
 SF_PROJECT_NAME=<project name>
 SF_APP_NAME=<app-name>
 SF_PROFILE_KEY=<profile-key>
Install the dotenv library.
npm install dotenvAdd the below code in your application main file to read environment variables from
.envfile and load it using require('dotenv').config() and access the variables it in code using process.env.<ENV_VAR>.require('dotenv').config();iii. Add the following source code in the main file to integrate the Express application to the SnappyFlow.
const Snappyflow = require('sf-apm-lib');
// Initialize Snappyflow. By default intialization will take profileKey, projectName and appName from sfagent config.yaml.
var sfObj = new Snappyflow();

// Add below part to manually configure the initialization
let projectName = process.env.SF_PROJECT_NAME;
let appName = process.env.SF_APP_NAME;
let profileKey = process.env.SF_PROFILE_KEY;
sfObj.init(profileKey, projectName, appName);
let sfTraceConfig = sfObj.getTraceConfig();

var apm;
try {
   apm = require('elastic-apm-node').start({
         // Specify your service name for tracing.
         serviceName: 'node-trace',
         serverUrl: sfTraceConfig['SFTRACE_SERVER_URL'],
         globalLabels: sfTraceConfig['SFTRACE_GLOBAL_LABELS'],
         verifyServerCert: sfTraceConfig['SFTRACE_VERIFY_SERVER_CERT'] === undefined ? false : sfTraceConfig['SFTRACE_VERIFY_SERVER_CERT'],
         active: sfTraceConfig['SFTRACE_SERVER_URL'] === undefined ? false : true,
         stackTraceLimit: sfTraceConfig['SFTRACE_STACK_TRACE_LIMIT'],
         captureSpanStackTraces: sfTraceConfig['SFTRACE_CAPTURE_SPAN_STACK_TRACES'],
         metricsInterval: '0s',
         usePathAsTransactionName: true
    })
} catch (e) {
   console.log(e);
}
Verification
Once your application is up and running, follow the below steps to verfiy that the SnappyFlow has started to collect the traces.
- Make sure that the project and the application is created.
- In the app, click the View Dashboard icon.
- In the Dashboard window, go to Tracing section.
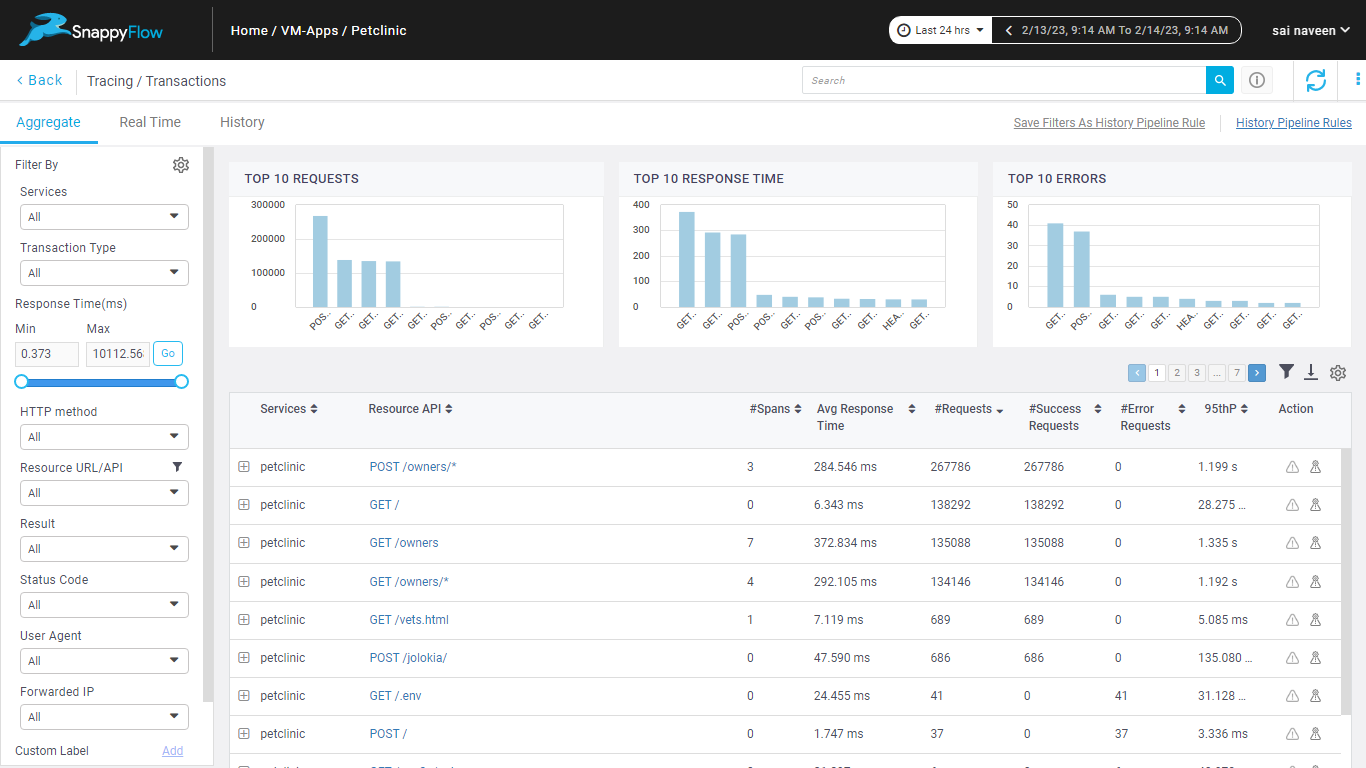
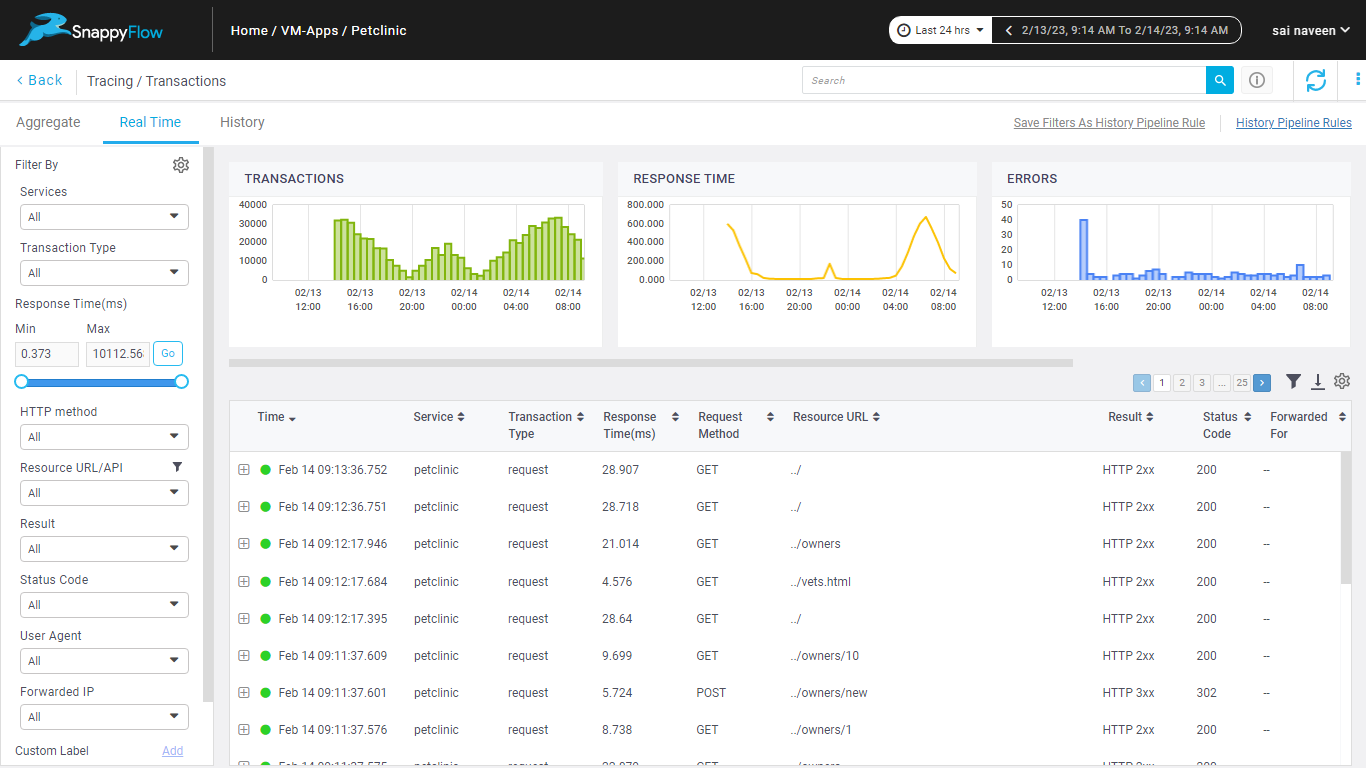
- In the Tracing section, click the View Transactions button.
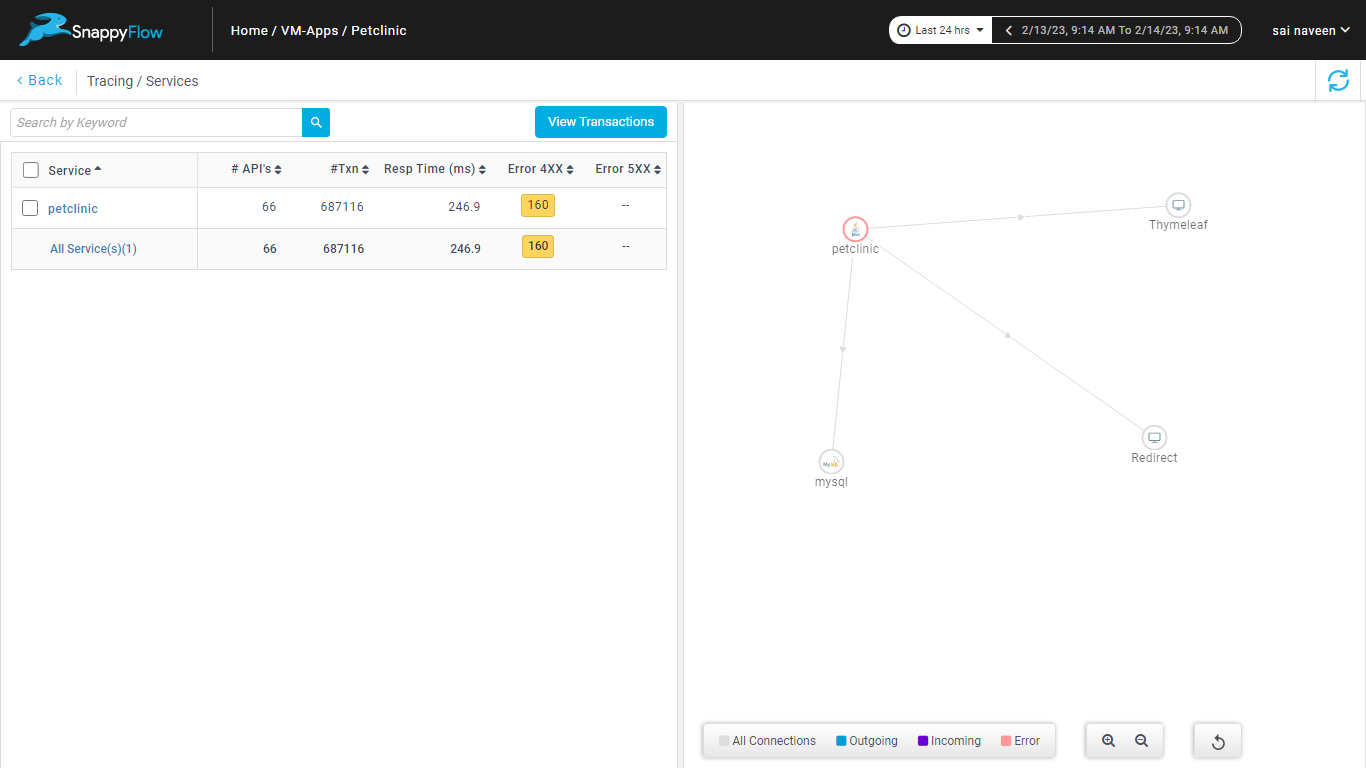
- Now you can view the traces in Aggregate and Real Time tabs.
Troubleshooting
If the trace data is not collected in the SnappyFlow server, then check the trace configuration in the application main file.
To enable the debug logs, add the below key-value pair in the apm code try block of the main file.
logLevel:'debug'
Node.JS Script
Install nodejs dependencies and save it in
package.jsonusingnpm install --save elastic-apm-node@^3.20.0
npm install --save sf-apm-lib@^1.0.2or update
package.jsonfile with following entries:"elastic-apm-node": "^3.20.0"
"sf-apm-lib": "^1.0.2"And run
npm installto install dependenciesAdd initilization code at start of the file
Get Snappyflow trace config using
const Snappyflow = require('sf-apm-lib');
let projectName = <SF_PROJECT_NAME>; //replace with appropriate project name
let appName = <SF_APP_NAME>; //replace with appropriate application name
let profileKey = <SF_PROFILE_KEY>; //replace with key copied from SF profile
var sfObj = new Snappyflow();
sfObj.init(profileKey, projectName, appName);
let sfTraceConfig = sfObj.getTraceConfig();Initialize apm object using
var apm;
try {
apm = require('elastic-apm-node').start({
serviceName: '<SERVICE_NAME>', // Specify service name for tracing
serverUrl: sfTraceConfig['SFTRACE_SERVER_URL'],
globalLabels: sfTraceConfig['SFTRACE_GLOBAL_LABELS'],
verifyServerCert: sfTraceConfig['SFTRACE_VERIFY_SERVER_CERT'] === undefined ? false : sfTraceConfig['SFTRACE_VERIFY_SERVER_CERT'],
active: sfTraceConfig['SFTRACE_SERVER_URL'] === undefined ? false : true,
stackTraceLimit: sfTraceConfig['SFTRACE_STACK_TRACE_LIMIT'],
captureSpanStackTraces: sfTraceConfig['SFTRACE_CAPTURE_SPAN_STACK_TRACES'],
metricsInterval: '0s',
usePathAsTransactionName: true
})
} catch (e) {
console.log(e);
}Create a custom transaction and span within transaction using following code
var trans = apm.startTransaction('json transaction', 'reference-app');
var span = apm.startSpan('parse json');
try {
JSON.parse('{"app": "test"}')
} catch (e) {
apm.captureError(e); // Capture the error using apm.captureError(e) method.
}
// when we've processed, stop the custom span
if (span) span.end()
trans.result = err ? 'error' : 'success';
// end the transaction
trans.end();For more info refer
https://www.elastic.co/guide/en/apm/agent/nodejs/current/custom-transactions.html
https://www.elastic.co/guide/en/apm/agent/nodejs/current/custom-spans.html
Run you script using node
file_name.jsyou should see trace data in Snappyflow server.For viewing trace in Snappyflow server make sure project and app name is created or discovered with project name and app name specified in point no.2
Once project and app name is created go to: View dashboard -> Click on Tracing on left side bar -> Click on view transaction -> Go to real time tab
Refer sample script file at:
[https://github.com/snappyflow/tracing-reference-apps/blob/master/refapp- express/node_trace_script.js](https://github.com/snappyflow/tracing-reference-apps/blob/master/refapp- express/node_trace_script.js )
Node.JS Sails
Install nodejs dependencies and save it in
package.jsonusingnpm install --save elastic-apm-node@^3.20.0
npm install --save sf-apm-lib@^1.0.2or update
package.jsonfile with following entries"elastic-apm-node": "^3.20.0"
"sf-apm-lib": "^1.0.2"And run
npm installto install dependenciesProvide
SF_PROJECT_NAME,SF_APP_NAME,SF_PROFILE_KEYas an environment variable in .env file and load it usingrequire('dotenv').config()and access it in code usingprocess.env.<ENV_VAR>Add initilization code at start of the file in
globals.jspresent in config folder.Get Snappyflow trace config using.
const Snappyflow = require('sf-apm-lib');
// Initialize Snappyflow. By default intialization will take profileKey, projectName and appName from sfagent config.yaml.
var sfObj = new Snappyflow();
// Add below part to manually configure the initialization
let projectName = process.env.SF_PROJECT_NAME;
let appName = process.env.SF_APP_NAME;
let profileKey = process.env.SF_PROFILE_KEY;
sfObj.init(profileKey, projectName, appName);
let sfTraceConfig = sfObj.getTraceConfig();
var apm;
try {
apm = require('elastic-apm-node').start({
// Specify your service name for tracing.
serviceName: 'node-trace',
serverUrl: sfTraceConfig['SFTRACE_SERVER_URL'],
globalLabels: sfTraceConfig['SFTRACE_GLOBAL_LABELS'],
verifyServerCert: sfTraceConfig['SFTRACE_VERIFY_SERVER_CERT'] === undefined ? false : sfTraceConfig['SFTRACE_VERIFY_SERVER_CERT'],
active: sfTraceConfig['SFTRACE_SERVER_URL'] === undefined ? false : true,
stackTraceLimit: sfTraceConfig['SFTRACE_STACK_TRACE_LIMIT'],
captureSpanStackTraces: sfTraceConfig['SFTRACE_CAPTURE_SPAN_STACK_TRACES'],
metricsInterval: '0s',
usePathAsTransactionName: true
})
} catch (e) {
console.log(e);
}Initialize apm object using:
var apm;
try {
apm = require('elastic-apm-node').start({
serviceName: '<SERVICE_NAME>', // Specify your service name for tracing
serverUrl: sfTraceConfig['SFTRACE_SERVER_URL'],
globalLabels: sfTraceConfig['SFTRACE_GLOBAL_LABELS'],
verifyServerCert: sfTraceConfig['SFTRACE_VERIFY_SERVER_CERT'] === undefined ? false : sfTraceConfig['SFTRACE_VERIFY_SERVER_CERT'],
active: sfTraceConfig['SFTRACE_SERVER_URL'] === undefined ? false : true,
stackTraceLimit: sfTraceConfig['SFTRACE_STACK_TRACE_LIMIT'],
captureSpanStackTraces: sfTraceConfig['SFTRACE_CAPTURE_SPAN_STACK_TRACES'],
metricsInterval: '0s',
usePathAsTransactionName: true
})
} catch (e) {
console.log(e);
}Attach apm object to globals – This is required so we can use apm variable in other files as part of global sails object.
module.exports.globals = {
_: require('@sailshq/lodash'),
async: false,
models: true,
sails: true,
apm : apm,
logger: logger
};Also add middleware in
http.jsfile present in config folder. Which allows to instrument our code.module.exports.http = {
middleware: {
order: [
'elasticAPM'
],
elasticAPM: (function () {
return function (err, req, res, next) {
apm.middleware.connect();
if (typeof err !== 'undefined')
apm.captureError(err);
return next();
};
})()
}
};
Once your server is up and running you can check trace in Snappyflow Server.
For viewing trace in snappyflow server make sure project and app name is created or discovered with project name and app name specified in point no.2
Once project and app name is created go to
View dashboard -> Click on Tracing on lef side bar -> Click on view transaction -> Go to real time tab
For complete code refer sample app refer at:
https://github.com/snappyflow/tracing-reference-apps/tree/master/RefappNodeSail
- Note: 'captureBody':'all' config should be present in apm agent code instrumentation for Trace to Log feature.
Kubernetes
Node.JS Express
Follow the below steps to enable the tracing for the application based on Node.JS Express.
Configuration
Install the below nodejs libraries using CLI.
npm install --save elastic-apm-node@^3.20.0
npm install --save sf-apm-lib@^1.0.2
or update the
package.jsonfile with following entries."elastic-apm-node": "^3.20.0"
"sf-apm-lib": "^1.0.2"and run the
npm installcommand in the CLI to install dependencies.Make sure the project and application is created in the SnappyFlow Server. Click Here to know how to create the project and application in SnappyFlow.
Add the below entries in your application’s main file at starting of the file (usually
index.js,server.jsorapp.js).const Snappyflow = require('sf-apm-lib');
var sfObj = new Snappyflow();
// Add below part to manually configure the initialization
let projectName = process.env.SF_PROJECT_NAME;
let appName = process.env.SF_APP_NAME;
let profileKey = process.env.SF_PROFILE_KEY;
sfObj.init(profileKey, projectName, appName);
let sfTraceConfig = sfObj.getTraceConfig();
var apm;
try {
apm = require('elastic-apm-node').start({
// Specify your service name for tracing.
serviceName: 'node-trace',
serverUrl: sfTraceConfig['SFTRACE_SERVER_URL'],
globalLabels: sfTraceConfig['SFTRACE_GLOBAL_LABELS'],
verifyServerCert: sfTraceConfig['SFTRACE_VERIFY_SERVER_CERT'] === undefined ? false : sfTraceConfig['SFTRACE_VERIFY_SERVER_CERT'],
active: sfTraceConfig['SFTRACE_SERVER_URL'] === undefined ? false : true,
stackTraceLimit: sfTraceConfig['SFTRACE_STACK_TRACE_LIMIT'],
captureSpanStackTraces: sfTraceConfig['SFTRACE_CAPTURE_SPAN_STACK_TRACES'],
metricsInterval: '0s',
usePathAsTransactionName: true
})
} catch (e) {
console.log(e);
}Provide
SF_PROJECT_NAME,SF_APP_NAME,SF_PROFILE_KEYas an environment variables in Kubernetes deployment file.#deployment.yaml
apiVersion: apps/v1
kind: Deployment
metadata:
name: node-app
labels:
app: node-app
spec:
containers:
- name: node-app
image: imagename/tag:version
env:
- name: SF_PROFILE_KEY
value: <profle-key>
- name: SF_PROJECT_NAME
value: <project_name>
- name: SF_APP_NAME
value: <app-name>If the deployment is with helm charts, provide the above variables in the
values.yamland use them in the deployment file of charts.#values.yaml
global:
# update the sfappname, sfprojectname and key with the proper values
sfappname: <app-name>
sfprojectname: <project-name>
key: <profile-key>
replicaCount: 1
image:
repository: nodeapp
pullPolicy: IfNotPresent
tag: "latest"Pass the global section key-value from the
value.yamlby setting thedeployment.yamlas below :#deployment.yaml
apiVersion: apps/v1
kind: Deployment
spec:
containers:
- name: {{ .Chart.Name }}
image: "{{ .Values.image.repository }}:{{ .Values.image.tag }}"
imagePullPolicy: {{ .Values.image.pullPolicy }}
env:
- name: SF_PROFILE_KEY
value: {{ .Values.global.key }}
- name: SF_PROJECT_NAME
value: {{ .Values.global.sfprojectname }}
- name: SF_APP_NAME
value: {{ .Values.global.sfappname }}
Verification
Once your application is up and running, follow the below steps to verfiy that the SnappyFlow has started to collect the traces.
- Make sure that the project and the application is created.
- In the app, click the View Dashboard icon.
- In the Dashboard window, go to Tracing section.
- In the Tracing section, click the View Transactions button.
- Now you can view the traces in Aggregate and Real Time tabs.
Troubleshooting
If the trace data is not collected in the SnappyFlow server, then check the trace configuration in the application main file.
To enable the debug logs, add the below key-value pair in the apm code try block of the main file.
logLevel:'debug'
Node.JS Sails
Install nodejs dependencies and save it in
package.jsonusingnpm install --save elastic-apm-node@^3.20.0
npm install --save sf-apm-lib@^1.0.2or update
package.jsonfile with following entries:"elastic-apm-node": "^3.20.0"
"sf-apm-lib": "^1.0.2"And run
npm installto install dependenciesAdd initilization code at start of the file in
globals.jspresent in config folder.Get Snappyflow trace config using
const Snappyflow = require('sf-apm-lib');
var sfObj = new Snappyflow(); // Initialize Snappyflow. By default intialization will take profileKey, projectName and appName from sfagent config.yaml.
// Add below part to manually configure the initialization
let projectName = process.env.SF_PROJECT_NAME;
let appName = process.env.SF_APP_NAME;
let profileKey = process.env.SF_PROFILE_KEY;
sfObj.init(profileKey, projectName, appName); // Manual override
let sfTraceConfig = sfObj.getTraceConfig();
// Start Trace to log feature section
// Add below line of code to enable Trace to log feature:
sfTraceConfig['SFTRACE_GLOBAL_LABELS'] += ',_tag_redact_body=true'
// Option Configs for trace to log
// Add below line to provide custom documentType (Default:"user-input"):
sfTraceConfig['SFTRACE_GLOBAL_LABELS'] += ',_tag_documentType=<document-type>'
// Add below line to provide destination index (Default:"log"):
sfTraceConfig['SFTRACE_GLOBAL_LABELS'] += ',_tag_IndexType=<index-type>' // Applicable values(log, metric)
// End trace to log sectionInitialize apm object using
var apm;
try {
apm = require('elastic-apm-node').start({
serviceName: '<SERVICE_NAME>', // Specify your service name for tracing
serverUrl: sfTraceConfig['SFTRACE_SERVER_URL'],
globalLabels: sfTraceConfig['SFTRACE_GLOBAL_LABELS'],
verifyServerCert: sfTraceConfig['SFTRACE_VERIFY_SERVER_CERT'] === undefined ? false : sfTraceConfig['SFTRACE_VERIFY_SERVER_CERT'],
active: sfTraceConfig['SFTRACE_SERVER_URL'] === undefined ? false : true,
stackTraceLimit: sfTraceConfig['SFTRACE_STACK_TRACE_LIMIT'],
captureSpanStackTraces: sfTraceConfig['SFTRACE_CAPTURE_SPAN_STACK_TRACES'],
metricsInterval: '0s',
usePathAsTransactionName: true
})
} catch (e) {
console.log(e);
}Attach apm object to globals – This is required so we can use apm variable in other files as part of global sails object
module.exports.globals = {
_: require('@sailshq/lodash'),
async: false,
models: true,
sails: true,
apm : apm,
logger: logger
};Also add middleware in
http.jsfile present in config folder. Which allows to instrument our codemodule.exports.http = {
middleware: {
order: [
'elasticAPM'
],
elasticAPM: (function () {
return function (err, req, res, next) {
apm.middleware.connect();
if (typeof err !== 'undefined')
apm.captureError(err);
return next();
};
})()
}
};
Provide
SF_PROJECT_NAME,SF_APP_NAME,SF_PROFILE_KEYas an environment variables in Kubernetes deployment file.https://kubernetes.io/docs/tasks/inject-data-application/define-environment-variable-container/
If deploying with helm provide above variables in values.yaml and use them in deployment file of charts.
Once your server is up and running you can check trace in Snappyflow Server.
For viewing trace in snappyflow server make sure project and app name is created or discovered with project name and app name specified in point no.2
Once project and app name is created go to
View dashboard -> Click on Tracing on lef side bar -> Click on view transaction -> Go to real time tab
For complete code refer sample app refer at:
https://github.com/snappyflow/tracing-reference-apps/tree/master/RefappNodeSail
- Note: 'captureBody':'all' config should be present in apm agent code instrumentation for Trace to Log feature.
Docker
Node.JS Express
Follow the below steps to enable the tracing for the application based on Node.JS Express.
Configuration
Install the below nodejs libraries using CLI.
npm install --save elastic-apm-node@^3.20.0
npm install --save sf-apm-lib@^1.0.2
or update the
package.jsonfile with following entries."elastic-apm-node": "^3.20.0"
"sf-apm-lib": "^1.0.2"and run the
npm installcommand in the CLI to install dependencies.Make sure the project and application is created in the SnappyFlow Server. Click Here to know how to create the project and application in SnappyFlow.
Add the below entries in your application’s main file at starting of the file (usually
index.js,server.jsorapp.js).const Snappyflow = require('sf-apm-lib');
var sfObj = new Snappyflow();
// Add below part to manually configure the initialization
let projectName = process.env.SF_PROJECT_NAME;
let appName = process.env.SF_APP_NAME;
let profileKey = process.env.SF_PROFILE_KEY;
sfObj.init(profileKey, projectName, appName);
let sfTraceConfig = sfObj.getTraceConfig();
var apm;
try {
apm = require('elastic-apm-node').start({
// Specify your service name for tracing.
serviceName: 'node-trace',
serverUrl: sfTraceConfig['SFTRACE_SERVER_URL'],
globalLabels: sfTraceConfig['SFTRACE_GLOBAL_LABELS'],
verifyServerCert: sfTraceConfig['SFTRACE_VERIFY_SERVER_CERT'] === undefined ? false : sfTraceConfig['SFTRACE_VERIFY_SERVER_CERT'],
active: sfTraceConfig['SFTRACE_SERVER_URL'] === undefined ? false : true,
stackTraceLimit: sfTraceConfig['SFTRACE_STACK_TRACE_LIMIT'],
captureSpanStackTraces: sfTraceConfig['SFTRACE_CAPTURE_SPAN_STACK_TRACES'],
metricsInterval: '0s',
usePathAsTransactionName: true
})
} catch (e) {
console.log(e);
}Provide
SF_PROJECT_NAME,SF_APP_NAME,SF_PROFILE_KEYas an environment variables indocker-compose.ymlor docker stack deployment file or at command line while using docker run command for deployment.Follow the below referrence documentation:
https://docs.docker.com/compose/environment-variables/
Docker RUN:
docker run -d -t -i -e SF_PROJECT_NAME='' \
-e SF_APP_NAME='' \
-e SF_PROFILE_KEY='' \
-p 80:80 \
--link redis:redis \
--name <container_name> <dockerhub_id/image_name>
Verification
Once your application is up and running, follow the below steps to verfiy that the SnappyFlow has started to collect the traces.
- Make sure that the project and the application is created.
- In the app, click the View Dashboard icon.
- In the Dashboard window, go to Tracing section.
- In the Tracing section, click the View Transactions button.
- Now you can view the traces in Aggregate and Real Time tabs.
Troubleshooting
If the trace data is not collected in the SnappyFlow server, then check the trace configuration in the application main file.
To enable the debug logs, add the below key-value pair in the apm code try block of the main file.
logLevel:'debug'
Node.JS Sails
Install nodejs dependencies and save it in
package.jsonusingRUN npm install --save elastic-apm-node@^3.20.0
RUN npm install --save sf-apm-lib@^1.0.2or update
package.jsonfile with following entries:"elastic-apm-node": "^3.20.0"
"sf-apm-lib": "^1.0.2"And run ‘npm install’ to install dependencies
Add initilization code at start of the file in
globals.jspresent in config folder.Get Snappyflow trace config using
const Snappyflow = require('sf-apm-lib');
var sfObj = new Snappyflow(); // Initialize Snappyflow. By default intialization will take profileKey, projectName and appName from sfagent config.yaml.
// Add below part to manually configure the initialization
let projectName = process.env.SF_PROJECT_NAME;
let appName = process.env.SF_APP_NAME;
let profileKey = process.env.SF_PROFILE_KEY;
sfObj.init(profileKey, projectName, appName); // Manual override
let sfTraceConfig = sfObj.getTraceConfig();
// Start Trace to log feature section
// Add below line of code to enable Trace to log feature:
sfTraceConfig['SFTRACE_GLOBAL_LABELS'] += ',_tag_redact_body=true'
// Option Configs for trace to log
// Add below line to provide custom documentType (Default:"user-input"):
sfTraceConfig['SFTRACE_GLOBAL_LABELS'] += ',_tag_documentType=<document-type>'
// Add below line to provide destination index (Default:"log"):
sfTraceConfig['SFTRACE_GLOBAL_LABELS'] += ',_tag_IndexType=<index-type>' // Applicable values(log, metric)
// End trace to log sectionInitialize apm object using
var apm;
try {
   apm = require('elastic-apm-node').start({
        serviceName: '<SERVICE_NAME>', // Specify your service name for tracing
        serverUrl: sfTraceConfig['SFTRACE_SERVER_URL'],
        globalLabels: sfTraceConfig['SFTRACE_GLOBAL_LABELS'],
        verifyServerCert: sfTraceConfig['SFTRACE_VERIFY_SERVER_CERT'] === undefined ? false : sfTraceConfig['SFTRACE_VERIFY_SERVER_CERT'],
         active: sfTraceConfig['SFTRACE_SERVER_URL'] === undefined ? false : true,
        stackTraceLimit: sfTraceConfig['SFTRACE_STACK_TRACE_LIMIT'],
        captureSpanStackTraces: sfTraceConfig['SFTRACE_CAPTURE_SPAN_STACK_TRACES'],
         metricsInterval: '0s',
         usePathAsTransactionName: true
    })
} catch (e) {
   console.log(e);
}
Attach apm object to globals – This is required so we can use apm variable in other files as part of global sails object.
module.exports.globals = {
   _: require('@sailshq/lodash'),
   async: false,
   models: true,
   sails: true,
   apm : apm,
   logger: logger
};
Also add middleware in
http.jsfile present in config folder. Which allows to instrument our code.module.exports.http = {
middleware: {
order: [
'elasticAPM'
],
elasticAPM: (function () {
return function (err, req, res, next) {
apm.middleware.connect();
if (typeof err !== 'undefined')
apm.captureError(err);
return next();
};
})()
}
};
Provide
SF_PROJECT_NAME,SF_APP_NAME,SF_PROFILE_KEYas an environment variables indocker-compose.ymlor docker stack deployment file or at command line when using docker run command for deployment.Eg:
Docker-compose and stack: https://docs.docker.com/compose/environment-variables/
Docker run cli command:
docker run -d -t -i -e SF_PROJECT_NAME='<SF_PROJECT_NAME>' \
-e SF_APP_NAME='<SF_APP_NAME>' \
-e SF_PROFILE_KEY='<snappyflow profile key>' \
--name <container_name> <dockerhub_id/image_name>Once your server is up and running you can check trace in Snappyflow Server.
For viewing trace in snappyflow server make sure project and app name is created or discovered with project name and app name specified in point no.2
Once project and app name is created go to
View dashboard -> Click on Tracing on lef side bar -> Click on view transaction -> Go to real time tab
For complete code refer sample app refer at:
https://github.com/snappyflow/tracing-reference-apps/tree/master/RefappNodeSail
- Note: 'captureBody':'all' config should be present in apm agent code instrumentation for Trace to Log feature.
ECS
Node.JS Express
Follow the below steps to enable the tracing for the application based on Node.JS Express.
Configuration
Install the below nodejs libraries using CLI.
npm install --save elastic-apm-node@^3.20.0
npm install --save sf-apm-lib@^1.0.2
or update the
package.jsonfile with following entries."elastic-apm-node": "^3.20.0"
"sf-apm-lib": "^1.0.2"and run the
npm installcommand in the CLI to install dependencies.Make sure the project and application is created in the SnappyFlow Server. Click Here to know how to create the project and application in SnappyFlow.
Add the below entries in your application’s main file at starting of the file (usually
index.js,server.jsorapp.js).const Snappyflow = require('sf-apm-lib');
var sfObj = new Snappyflow();
// Add below part to manually configure the initialization
let projectName = process.env.SF_PROJECT_NAME;
let appName = process.env.SF_APP_NAME;
let profileKey = process.env.SF_PROFILE_KEY;
sfObj.init(profileKey, projectName, appName);
let sfTraceConfig = sfObj.getTraceConfig();
var apm;
try {
apm = require('elastic-apm-node').start({
// Specify your service name for tracing.
serviceName: 'node-trace',
serverUrl: sfTraceConfig['SFTRACE_SERVER_URL'],
globalLabels: sfTraceConfig['SFTRACE_GLOBAL_LABELS'],
verifyServerCert: sfTraceConfig['SFTRACE_VERIFY_SERVER_CERT'] === undefined ? false : sfTraceConfig['SFTRACE_VERIFY_SERVER_CERT'],
active: sfTraceConfig['SFTRACE_SERVER_URL'] === undefined ? false : true,
stackTraceLimit: sfTraceConfig['SFTRACE_STACK_TRACE_LIMIT'],
captureSpanStackTraces: sfTraceConfig['SFTRACE_CAPTURE_SPAN_STACK_TRACES'],
metricsInterval: '0s',
usePathAsTransactionName: true
})
} catch (e) {
console.log(e);
}Provide
SF_PROJECT_NAME,SF_APP_NAME,SF_PROFILE_KEYas an environment variables in add container section of task definitions.Refer the below documentation: https://catalog.us-east-1.prod.workshops.aws/workshops/c6bdf8dc-d2b2-4dbd-b673-90836e954745/en-US/container-migration/create-task-definition
Verification
Once your application is up and running, follow the below steps to verfiy that the SnappyFlow has started to collect the traces.
- Make sure that the project and the application is created.
- In the app, click the View Dashboard icon.
- In the Dashboard window, go to Tracing section.
- In the Tracing section, click the View Transactions button.
- Now you can view the traces in Aggregate and Real Time tabs.
Troubleshooting
If the trace data is not collected in the SnappyFlow server, then check the trace configuration in the application main file.
To enable the debug logs, add the below key-value pair in the apm code try block of the main file.
logLevel:'debug'
Node.JS Sails
Install nodejs dependencies and save it in
package.jsonusingnpm install --save elastic-apm-node@^3.20.0
npm install --save sf-apm-lib@^1.0.2or update
package.jsonfile with following entries"elastic-apm-node": "^3.20.0"
"sf-apm-lib": "^1.0.2"And run
npm installto install dependenciesAdd initialization code at start of the file in
globals.jspresent in config folder.Get Snappyflow trace config using
const Snappyflow = require('sf-apm-lib');
var sfObj = new Snappyflow(); // Initialize Snappyflow. By default intialization will take profileKey, projectName and appName from sfagent config.yaml.

// Add below part to manually configure the initialization
let projectName = process.env.SF_PROJECT_NAME;
let appName = process.env.SF_APP_NAME;
let profileKey = process.env.SF_PROFILE_KEY;
sfObj.init(profileKey, projectName, appName); // Manual override

let sfTraceConfig = sfObj.getTraceConfig();

// Start Trace to log feature section
// Add below line of code to enable Trace to log feature:
sfTraceConfig['SFTRACE_GLOBAL_LABELS'] += ',_tag_redact_body=true'
// Option Configs for trace to log
// Add below line to provide custom documentType (Default:"user-input"):
sfTraceConfig['SFTRACE_GLOBAL_LABELS'] += ',_tag_documentType=<document-type>'
// Add below line to provide destination index (Default:"log"):
sfTraceConfig['SFTRACE_GLOBAL_LABELS'] += ',_tag_IndexType=<index-type>' // Applicable values(log, metric)
// End trace to log section
Initialize apm object using
var apm;
try {
   apm = require('elastic-apm-node').start({
      serviceName: '<SERVICE_NAME>', // Specify your service name for tracing
      serverUrl: sfTraceConfig['SFTRACE_SERVER_URL'],
      globalLabels: sfTraceConfig['SFTRACE_GLOBAL_LABELS'],
      verifyServerCert: sfTraceConfig['SFTRACE_VERIFY_SERVER_CERT'] === undefined ? false : sfTraceConfig['SFTRACE_VERIFY_SERVER_CERT'],
      active: sfTraceConfig['SFTRACE_SERVER_URL'] === undefined ? false : true,
      stackTraceLimit: sfTraceConfig['SFTRACE_STACK_TRACE_LIMIT'],
      captureSpanStackTraces: sfTraceConfig['SFTRACE_CAPTURE_SPAN_STACK_TRACES'],
      metricsInterval: '0s',
      usePathAsTransactionName: true
   })
} catch (e) {
   console.log(e);
}
Attach apm object to globals – This is required so we can use apm variable in other files as part of global sails object
module.exports.globals = {
   _: require('@sailshq/lodash'),
   async: false,
   models: true,
   sails: true,
   apm : apm,
   logger: logger
};
Also add middleware in
http.jsfile present in config folder. Which allows to instrument our codemodule.exports.http = {
middleware: {
order: [
'elasticAPM'
],
elasticAPM: (function () {
return function (err, req, res, next) {
apm.middleware.connect();
if (typeof err !== 'undefined')
apm.captureError(err);
return next();
};
})()
}
};
Provide
SF_PROJECT_NAME,SF_APP_NAME,SF_PROFILE_KEYas an environment variables in add container section of task definitions.https://docs.aws.amazon.com/AmazonECS/latest/developerguide/taskdef-envfiles.html
Once your server is up and running you can check trace in Snappyflow Server.
For viewing trace in snappyflow server make sure project and app name is created or discovered with project name and app name specified in point no.2
Once project and app name is created go to
View dashboard -> Click on Tracing on lef side bar -> Click on view transaction -> Go to real time tab
For complete code refer sample app refer at:
https://github.com/snappyflow/tracing-reference-apps/tree/master/RefappNodeSail
- Note: 'captureBody':'all' config should be present in apm agent code instrumentation for Trace to Log feature.
AWS Lambda
Install dependency libraries in the node_modules directory using the npm install command
npm install sf-apm-lib@^1.0.2
npm install elastic-apm-node@^3.20.0
Ref: https://docs.aws.amazon.com/lambda/latest/dg/nodejs-package.html
Instrument lambda function to enable tracing
Add code outside lambda handler method to get tracing config and create trace client
// SnappyFlow Tracing config
const Snappyflow = require('sf-apm-lib');

let projectName = process.env.SF_PROJECT_NAME;
let appName = process.env.SF_APP_NAME;
let profileKey = process.env.SF_PROFILE_KEY;

var sfObj = new Snappyflow();
sfObj.init(profileKey, projectName, appName);

var apm;
try {
   var sfTraceConfig = sfObj.getTraceConfig();
   apm = require('elastic-apm-node').start({
      serviceName: '<SERVICE_NAME_CHANGEME>',
      serverUrl: sfTraceConfig['SFTRACE_SERVER_URL'],
      globalLabels: sfTraceConfig['SFTRACE_GLOBAL_LABELS'],
      verifyServerCert: sfTraceConfig['SFTRACE_VERIFY_SERVER_CERT'] === undefined ? false : sfTraceConfig['SFTRACE_VERIFY_SERVER_CERT'],
      active: sfTraceConfig['SFTRACE_SERVER_URL'] === undefined ? false : true,
      stackTraceLimit: sfTraceConfig['SFTRACE_STACK_TRACE_LIMIT'],
      captureSpanStackTraces: sfTraceConfig['SFTRACE_CAPTURE_SPAN_STACK_TRACES'],
      captureBody: 'all' ,
      metricsInterval: '0s',
      usePathAsTransactionName: true
  })
} catch (e) {
   console.log(e)
}
Add custom instrumentation inside lambda handler method
Ref: https://www.elastic.co/guide/en/apm/agent/nodejs/current/custom-transactions.html
https://www.elastic.co/guide/en/apm/agent/nodejs/current/custom-spans.html
// Create custom transaction
var trans = apm.startTransaction('lambda handler', 'lambda');
//Create custom span is needed
var span = apm.startSpan('parse json');
// your CODE here
// End of span
if (span) span.end()
//Some more code part of the transaction or add more spans here. Don’t RETURN/EXIT  //end custom transaction
trans.result = 'success';
trans.end();
// RETURN code
Deploy the lambda app. Follow README to test sample app
Reference app:
https://github.com/upendrasahu/aws-lambda-nodejs-tracing-sample
Configure Lambda function before trigger/invoke.
Add the environment variable
SF_PROFILE_KEYand set the value to your profile key copied from SnappyFlow.Add environment variables
SF_APP_NAMEandSF_PROJECT_NAMEwith appropriate values. Create this Project and Application in SnappyFlow if not already present.
At this point you can trigger lambda function and get tracing data in SnappyFlow.
Capture Request Body from Trace
This feature allows you to save the request body of the HTTP transactions to a specific index such as a log.
Request bodies usually contain sensitive data like passwords and credit card numbers. If your service handles data like this, we advise you to enable this feature with care.
Configuration
Add the below entries in your application’s main file.(usually
index.js,server.jsorapp.js)Update the apm code try block of tracing instrumentation code with the following key-value pair.
captureBody: 'all'Add the below line to capture the request body.
# default value is true,
sfTraceConfig['SFTRACE_GLOBAL_LABELS'] += ',_tag_redact_body=true'
Follow the below steps in the starting of the main file to customize the document type and destination index. (Optional)
Add below line to customize the destination index (Default:"log"), Applicable values(log, metric).
# default indexType is log, applicable values are log and metric
sfTraceConfig['SFTRACE_GLOBAL_LABELS'] += ',_tag_IndexType=log'
Add the below line to customize the document type
# default documentType is user-input
sfTraceConfig['SFTRACE_GLOBAL_LABELS'] += ',_tag_documentType=user-input'
The overall sample configuration is below:
sfTraceConfig['SFTRACE_GLOBAL_LABELS'] += ',_tag_redact_body=true';
sfTraceConfig['SFTRACE_GLOBAL_LABELS'] += ',_tag_IndexType=log';
sfTraceConfig['SFTRACE_GLOBAL_LABELS'] += ',_tag_documentType=user-input';
try {
    apm = require('elastic-apm-node').start({
       captureBody: 'all'
    });
  } catch (e) {
   console.log(e);
 }
Verification
In the app, click the View Dashboard icon.
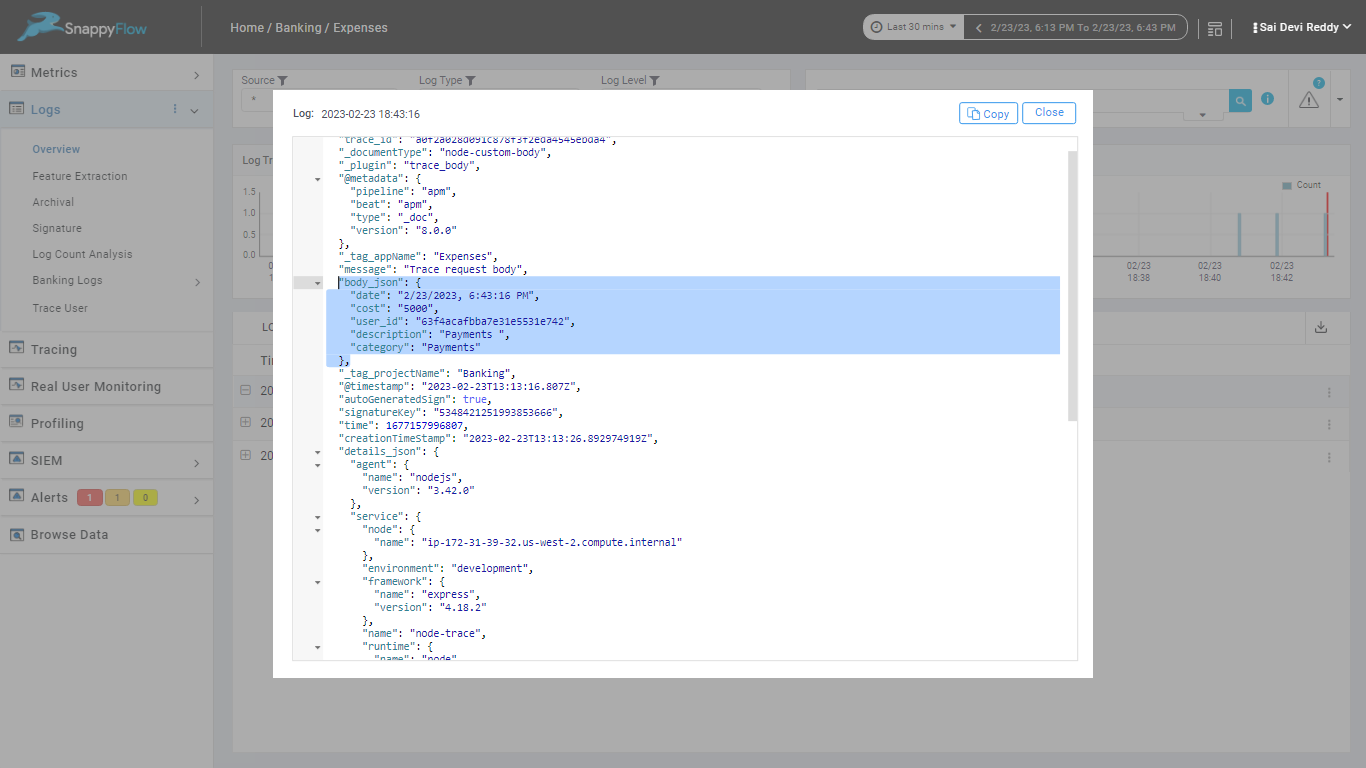
If you provided the index type is log:
a. In the Dashboard window, go to Logs section.
b. In the Overview windows, select the Source and Log Type.
c. Now you can view the logs in the dashboard.
If you provided the index type as metric:
a. In the Dashboard window, go to Browse Data section.
b. select the plugin as trace_body and document type.
c. Now you can view the logs in the dashboard.
Log Correlation
If you are using existing logger in your application then embed transaction id, trace id and span id using elastic apm node client object which was created at the start of the application. For more info refer apm initialization code.
Eg.
   var traceId = 'None';
   var transactionId = 'None';
   var spanId = 'None';
   if (typeof(apm) !== 'undefined') {

      var apmTraceObj = apm.currentTraceIds; // Apm object having current trace ids
      transactionId = apmTraceObj['transaction.id'] || 'None';
      traceId = apmTraceObj['trace.id'] || 'None';
      spanId = apmTraceObj['span.id'] || 'None';
   }
   var msg = `[${moment().format('DD/MMM/YYYY hh:mm:ss')}] [${level}] [${msg}] | elasticapm transaction.id=${transactionId} trace.id=${traceId} span.id=${spanId}\n`
For using Log correlation in application log file refer: https://www.elastic.co/guide/en/apm/agent/nodejs/current/log-correlation.html
Adding custom Snappyflow logger for log correlation
   //Copy logger file from snappyflow reference app to location where you want to put. Initialize logger in your app using following code:

   const logger = require("./logger").Logger;

   logger.attachAPM(apm);
   logger.setLogFilePath('/var/log/trace/ntrace.log');  //Put log file in /var/log/trace folder
   logger.init();

   //Write log
   logger.debug('Hello world get api called')
   logger.info('Hello world get api called')
   logger.error('Some error ocurred')
For code reference refer: https://github.com/snappyflow/tracing-reference-apps/blob/master/refapp-express/logger.js
Send log correlation data to snappyflow server
Below are the modes for sending log correlated data to snappyflow server
For Appliance
Install sfagent and create config file.
Refer: https://docs.snappyflow.io/docs/Integrations/os/linux/sfagent_linux
Add elasticApmLog plugin to sfagent config.yaml and restart sfagent service. Eg. Config.yaml
key: <SF_PROFILE_KEY>
tags:
  Name: <any-name>
  appName: <SF_APP_NAME>
  projectName: <SF_PROJECT_NAME>
logging:
  plugins:
    - name: elasticApmTraceLog
      enabled: true
      config:
         log_level:
            - error
            - warning
            - info
         log_path: /var/log/trace/ntrace.log  # Your app log file path
For Kubernetes
Specify following values in metadata labels section of deployment file.
snappyflow/appname: <SF_APP_NAME>
snappyflow/projectname: <SF_PROJECT_NAME>
snappyflow/component: gen-elastic-apm-log # This is must for tracing log correlation
Sample deployment file
apiVersion: apps/v1
kind: Deployment
metadata:
  labels:
    io.kompose.service: express-node
    snappyflow/appname: '<sf_app_name>'
    snappyflow/projectname: '<sf_project_name>'
    snappyflow/component: gen-elastic-apm-log
  name: express-node
spec:
  replicas: 1
  selector:
    matchLabels:
      io.kompose.service: express-node
  strategy: {}
  template:
    metadata:
      labels:
        io.kompose.service: express-node
        snappyflow/appname: '<sf_app_name>'
        snappyflow/projectname: '<sf_project_name>'
        snappyflow/component: gen-elastic-apm-log
    spec:
      containers:
        - env:
            - name: SF_APP_NAME
              value: '<sf_app_name>'
            - name: SF_PROFILE_KEY
              value: '<sf_profile_key>'
            - name: SF_PROJECT_NAME
              value: '<sf_project_name>'
          image: refapp-node:latest
          imagePullPolicy: Always
          name: express-node
          ports:
            - containerPort: 3000
          resources:
            requests:
              cpu: 10m
              memory: 10Mi
            limits:
              cpu: 50m
              memory: 50Mi
      restartPolicy: Always
For viewing trace and logs in Snappyflow server make sure project and app name is created or discovered. Once project and app name is created.
Go to: View App dashboard -> Click on Tracing on left side bar -> Click on view transaction -> Go to real time tab Then click on any trace and go to logs tab to see the correlated logs to trace.
// Note: To get trace in snappyflow server we need log entries to adhere following log format:
<date in following format>
[10/Aug/2021 10:51:16] [<log_level>] [<message>] | elasticapm transaction.id=<transaction_id> trace.id=<trace_id> span.id=<span_id>