Monitor Java Application in Kubernetes
Standard Deployment
Prerequisite
- Install Sftrace-agent to start tracing for an application running in Kubernetes.
- Make sure that the project and application are created in the SnappyFlow server. Click here to create a project and an application in SnappyFlow.
sfTraceagent has to run asinitContainerin the application pod.
Configuration
Add the below configuration to add the
sfTraceagent asinitContainerin the application container.# deployment.yaml
initContainers:
- name: sftrace-java-agent
image: busybox
command:
- sh
- -c
- -x
- wget -O /sfagent/sftrace-agent.tar.gz https://github.com/snappyflow/apm-agent/releases/download/latest/sftrace-agent.tar.gz && cd /sfagent && tar -xvzf sftrace-agent.tar.gz && rm sftrace-agent.tar.gz
volumeMounts:
- mountPath: /sfagent
name: sftrace-agentProvide the
SFTRACE_PROFILE_KEY,SFTRACE_PROFILE_KEY,SFTRACE_PROJECT_NAME,SFTRACE_APP_NAMEand theSFTRACE_AGENTpath.env:
- name: SFTRACE_PROFILE_KEY
value: <profile-key>
- name: SFTRACE_SERVICE_NAME
value: <service-name>
- name: SFTRACE_PROJECT_NAME
value: <project-name>
- name: SFTRACE_APP_NAME
value: <app-name>
- name: SFTRACE_AGENT
value: -javaagent:/sfagent/sftrace/java/sftrace-java-agent.jar
- name: ELASTIC_APM_DISABLE_INSTRUMENTATIONS
value: spring-mvc
- name: ELASTIC_APM_USE_PATH_AS_TRANSACTION_NAME
value: "true"Add the below-given
commandsection to your application container.containers:
- name: sample-java-app
image: imagename:tag
command:
- sh
-c
- java $(SFTRACE_AGENT) -jar jarnameIn the
volumeMountssection of your application container add themount path: /sfagentandname: sftrace-agent. In the volumes section, add thesftrace-agentvolume mounts.containers:
- name: sample-java-app
image: imagename:tag
volumeMounts:
- mountPath: /sfagent
name: sftrace-agent
volumes:
- name: sftrace-agent
emptyDir: {}
Sample Deployment file
Click here to view the sample application deployment yaml file for which the configuration mentioned in the above sections enables the tracing feature.
View Trace Data
Follow the below steps to view the trace data.
- Go to the Application tab in SnappyFlow and navigate to your Project > Application > Dashboard.
- In the dashboard window, navigate to the Tracing section and click the
View Transactionsbutton.
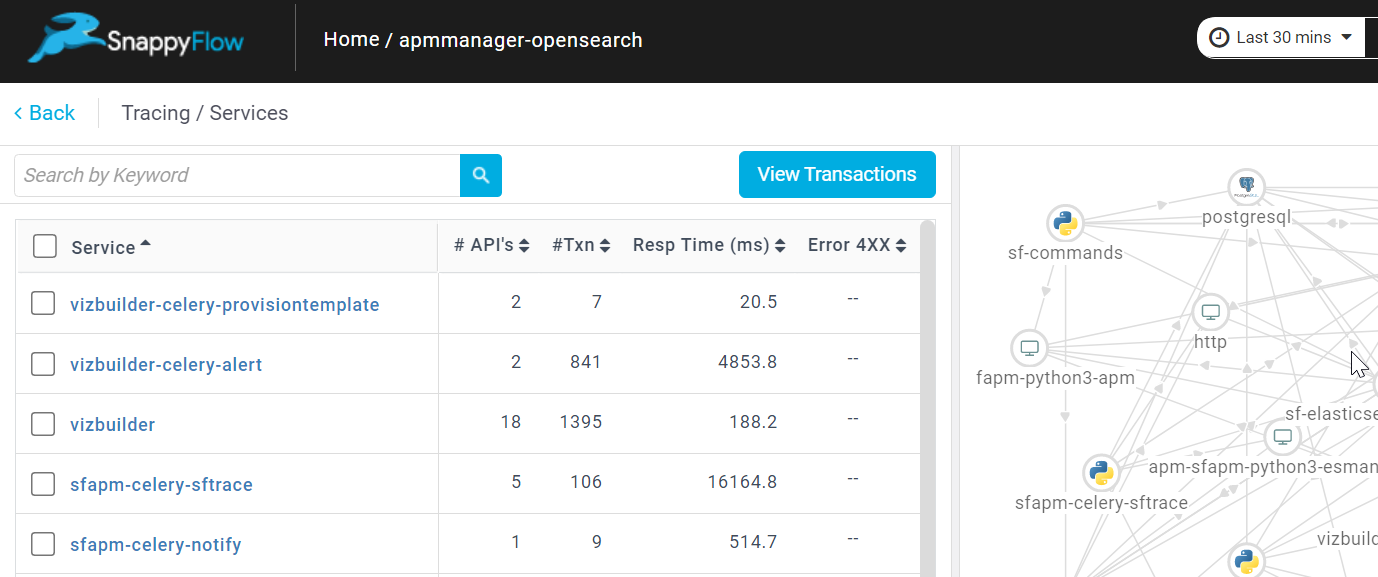
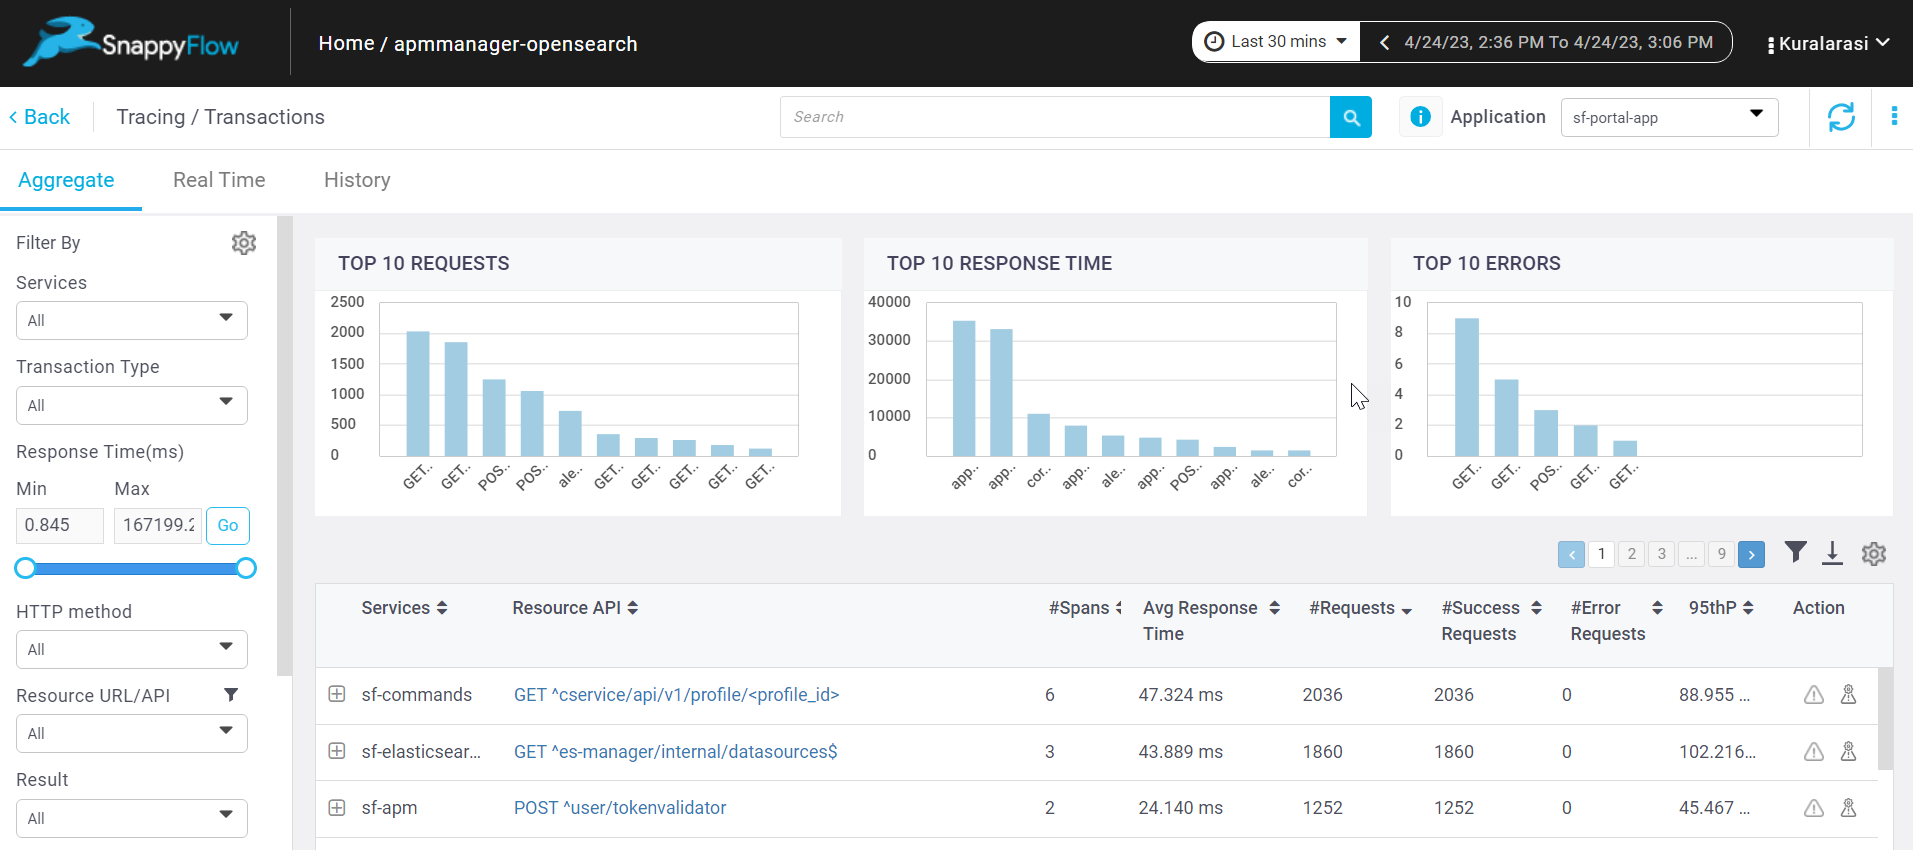
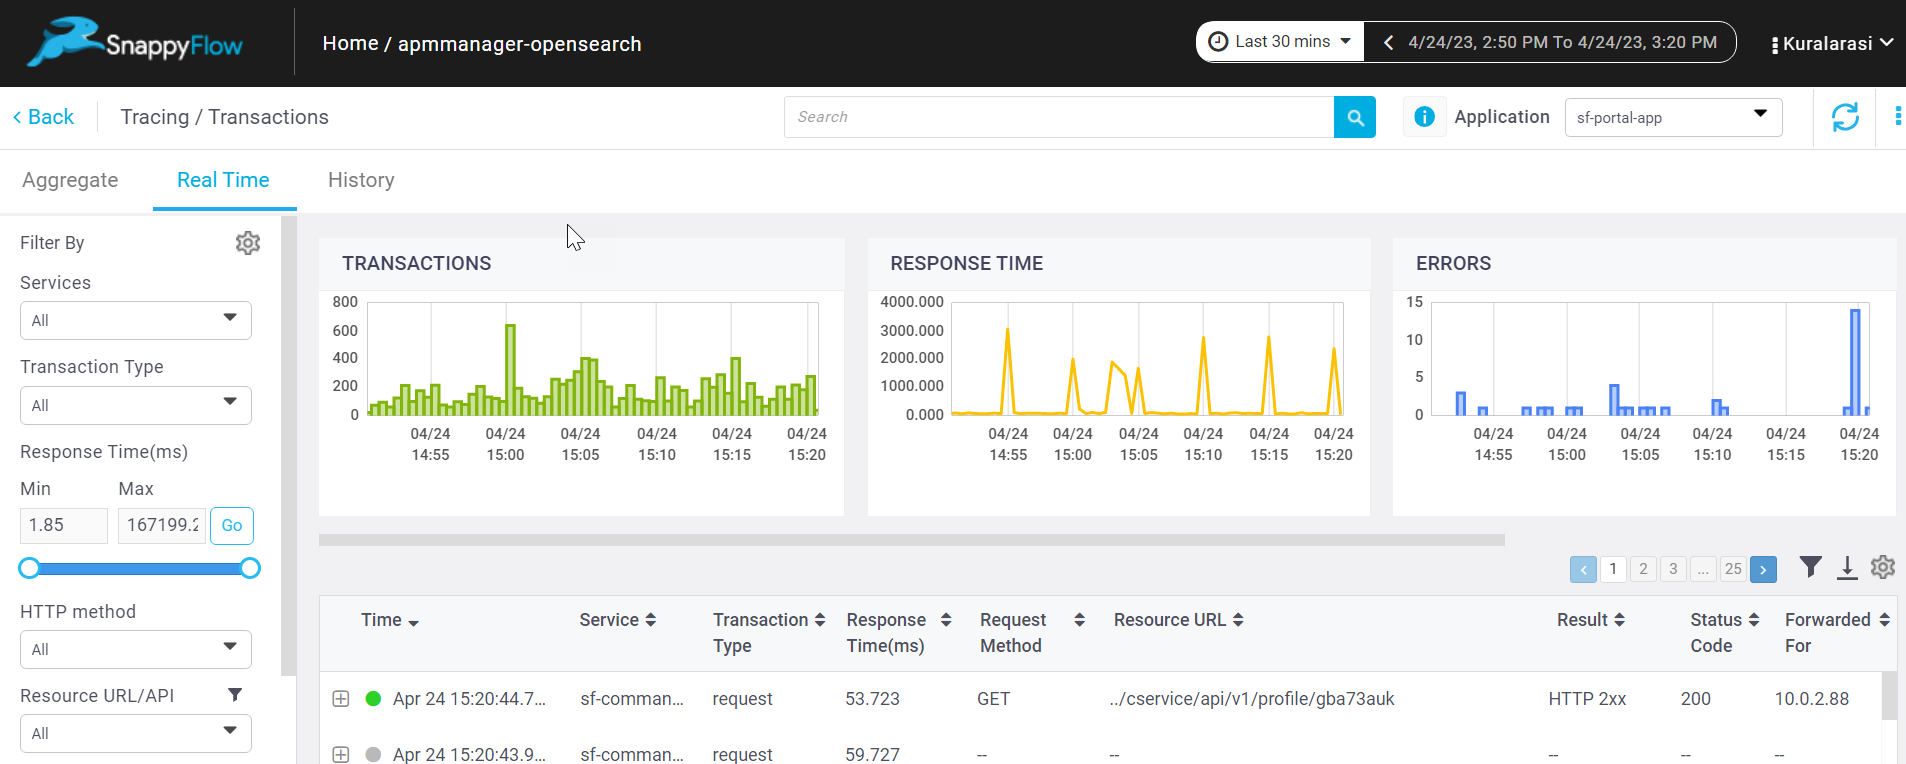
- You can view the traces in the Aggregate and the Real Time tabs.
Helm Chart Deployment
Prerequisite
- Install Sftrace-agent o start tracing for an application running in Kubernetes using helm chart deployment.
- Make sure that the project and application are created in the SnappyFlow server. Click here to create a project and an application in SnappyFlow.
sfTraceagent has to run asinitContainerin the application pod.
Configuration
Add the
SF_APP_NAME,SF_PROJECT_NAME, andSF_PROFILE_KEYin thevalues.yamlfile of the helm chart.#values.yaml
global:
# update the sfappname, sfprojectname and key with the proper values
sfappname: <app-name>
sfprojectname: <project-name>
key: <profile-key>
replicaCount: 1
image:
repository: spring-app
pullPolicy: IfNotPresent
tag: "latest"Add the below configuration in the
deployment .yamlfile to add thesfTraceagent as aninitContainersin the application container.# deployment.yaml
initContainers:
- name: sftrace-java-agent
image: busybox
command:
- sh
- -c
- -x
- wget -O /sfagent/sftrace-agent.tar.gz https://github.com/snappyflow/apm-agent/releases/download/latest/sftrace-agent.tar.gz && cd /sfagent && tar -xvzf sftrace-agent.tar.gz && rm sftrace-agent.tar.gz
volumeMounts:
- mountPath: /sfagent
name: sftrace-agentProvide the
SFTRACE_PROFILE_KEY,SFTRACE_PROFILE_KEY,SFTRACE_PROJECT_NAME,SFTRACE_APP_NAMEand theSFTRACE_AGENTpath.env:
- name: SFTRACE_PROFILE_KEY
value: {{ .Values.global.key }}
- name: SFTRACE_SERVICE_NAME
value: <service-name>
- name: SFTRACE_PROJECT_NAME
value: {{ .Values.global.sfprojectname }}
- name: SFTRACE_APP_NAME
value: {{ .Values.global.sfappname }}
- name: SFTRACE_AGENT
value: -javaagent:/sfagent/sftrace/java/sftrace-java-agent.jar
- name: ELASTIC_APM_DISABLE_INSTRUMENTATIONS
value: spring-mvc
- name: ELASTIC_APM_USE_PATH_AS_TRANSACTION_NAME
value: "true"Add the below-given
commandsection to your application container.containers:
- name: sample-java-app
image: imagename:tag
command:
- sh
- -c
- java $(SFTRACE_AGENT) -jar jarnameIn the
volumeMountssection of your application container add themountPath: /sfagentandname: sftrace-agent. In the volumes section, add thesftrace-agentvolume mounts.containers:
- name: sample-java-app
image: imagename:tag
volumeMounts:
- mountPath: /sfagent
name: sftrace-agent
volumes:
- name: sftrace-agent
emptyDir: {}
Sample Helm chart deployment
Update values.yaml:
Refer to the SFTRACE-CONFIG section in the java_k8s_with_helm_chart_values.yaml file to configure agent-specific properties.
Update deployment.yaml:
Refer to the SFTRACE-CONFIG section in the java_k8s_with_helm_chart_deployment.yaml file and copy the trace agent to the container and start the container by attaching the agent.
View Trace Data
Follow the below steps to view the trace data.
- Go to the Application tab in SnappyFlow and navigate to your Project > Application > Dashboard.
In the dashboard window, navigate to the Tracing section and click the
View Transactionsbutton.You can view the traces in the Aggregate and the Real Time tabs.