Analyzing ETL Jobs with SnappyFlow
Analytics processing usually requires user to run a sequence of database reads/write jobs and transformation operations. In many cases these jobs are complex and may take a long time to complete. It is a very common need of the users to monitor individual jobs runs, summarize performance of different jobs, compare two runs of a specific job type.
SnappyFlow provides an easy yet powerful tool to analyze ETL Jobs. The approach is explained in the following video
Step 1: Drop logs from ETL Jobs
SnappyFlow allows for a job to have up to a 3-level hierarchy- Job, Stage, Task. Logs in JSON format have to be dropped whenever a job/stage/task is started, completed or terminated. This log can be parsed using SnappyFlow’s ETL parser.
{
    "jobName": <Job-name>,
    "jobId": <Unique JobId>,
    "time": <Time in epoch milliseconds format>
    "type": "job",
    "status": <status: started, success, failed, aborted>
 }
 {
     "jobName": <Job-name>,
     "jobId": <Unique JobId>,
    "stageId": <stageId>,
    "stageName": <stageName>
     "time": <Time in epoch milliseconds format>
     "type": "stage",
     "status": <status can be started, success, failed, aborted>
 }
{
    "jobName": <Job-name>,
    "jobId": <Unique JobId>,
    “stageId”: <staged>,
    “stageName”: <stageName>
    "time": <Time in epoch milliseconds format>
    "type": "task",
    "status": <status can be started, success, failed, aborted>
}
Step 2: Forward logs to SnappyFlow
Add the following log parser to logging section of sfAgent’s config.yaml:
logging:
  plugins:
    - name: etlRaw
      enabled: true
        config:
          log_path: <log file path>
Restart sfAgent with the new configuration.
service sfagent restart
Check if documents have been received in SnappyFlow. You will find 3 documents under metrics with plugin name as “etlRaw” and documentType as “job”, “stage” and “task” depending on your hierarchy.
Step 3: Generate an access URL for use by summarization module
Logs shipped to SnappyFlow are in a raw form and they cannot be directly used for reporting and analysis. Therefore user has to export this raw data to a summarization script that transforms the data and sends it back to SnappyFlow into a new document.
Import a ETL template into your dashboard.
Go to “Scratchpad” pane
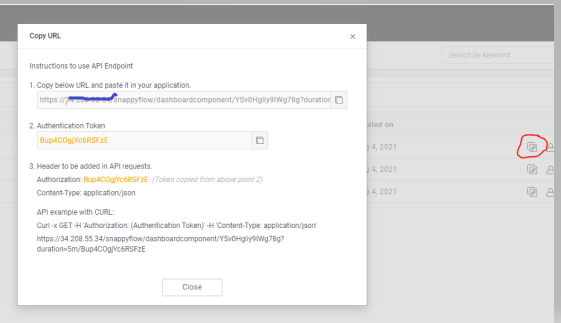
Click on ‘Export API Endpoint’ option in the component and create component URL for all 3 components for interval, say Last 5 mins.
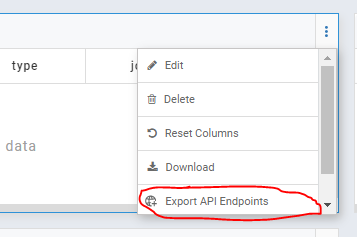
Click on the ‘API Endpoints’ option for the project to view the API List. Copy the URL’s for the 3 components and the Authentication token. These need to be provided in Step 4
Step 4: Run summarization script as a cronjob
Install the pip utility from the below link. Refer to the link for Installation and Usage instructions.
The python script takes a config file path as input
Set values for key, appName, projectName, Name.
Provide the component Url’s for Job, stage and Task and authKey (from Step 3)
The data will be available in the dashboard under the plugin ‘etlReport’ and documentType - job, stage and task.
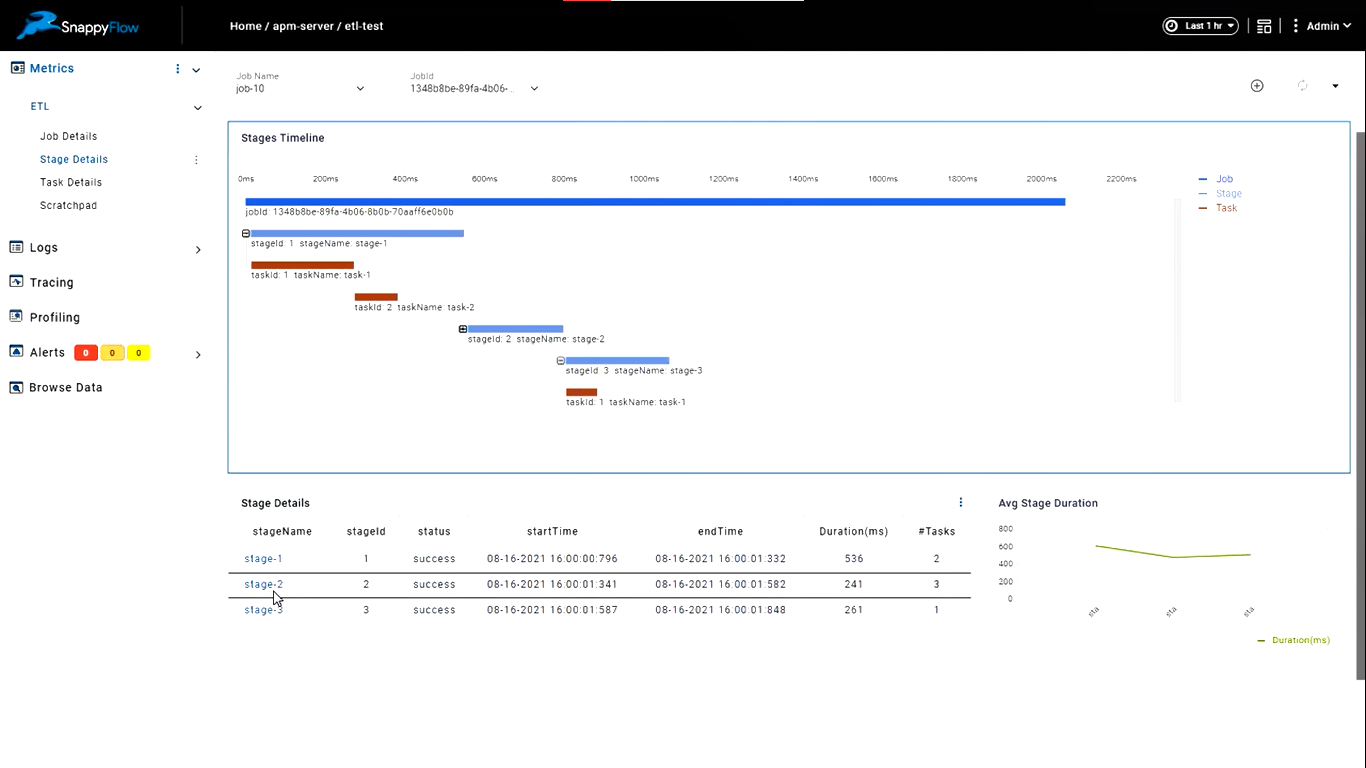
Step 5: Review ETL Dashboards
You will now see the summarized data in dashboard under etlReport for job, stage and tasks. Select a particular job and choose a timeline to see job duration trends over the selected time period. Clicking on a particular job id provides a drilled down view of stages and tasks within that job.