Table
Types of Table
There are two types of tables:
- Aggregation Table
- Non-Aggregation Table
Difference between Aggregation and Non- Aggregation table
An Aggregation table possesses the capability to execute operations such as counting, finding the maximum or minimum values, and more, on the metrics contained within the table.
On the contrary, a Non-Aggregation table is employed to display values derived from a series of JSON data in a structured tabular format.
Example of an Aggregation Table
If we need documents such as (Group: A, Name: x, Age: 10, Weight: 20), (Group B, Name: y, Age: 12, Weight: 22), (Group A, Name: xx, Age: 25, Weight: 100), (Group B, Name: yy, Age: 15, Weight: 70), a table for Select Age.avg, Weight.avg where Group == * provides an output as shown below.
| Group | Age | Weight |
|---|---|---|
| A | 17.5 | 60 |
| B | 13.5 | 46 |
In the above example, Table Key is Group.
Example of an Non-Aggregation Table
For the same example above, a query “Select Name, Group, Age, Weight” would provide the result as shown below that merely represents the data in a tabular form. The ordering by default will be in descending order of time.
| Group | Name | Age | Weight |
|---|---|---|---|
| A | x | 10 | 20 |
| B | y | 12 | 22 |
| C | xx | 25 | 100 |
| D | yy | 15 | 70 |
By default all the tables are Aggregation tables.
Follow the below steps convert an Aggregation table into Non-Aggregation table.
Go to the Advanced tab > Query section of the table component.
Check the
Aggregationcheck box.
OR
In the Main tab of the table, leave the Table Key field as empty.
Operation Performed by Aggregation Table
| Operation | Name of the Operation | Format |
|---|---|---|
| .count | Count | #name of the column = metrics.count. |
| .min | Minimum | #name of the column = metrics.min |
| .max | Maximum | #name of the column = metrics.max |
| .avg | Average | #name of the column = metrics.avg |
| .term | Term | #name of the column = metrics.term |
| .cardinality | Cardinality | #name of the column = metrics.cardinality |
| .nP | Percentile | #name of the column = metrics.np |
| + | Sum | #name of the column = metrics 1+metrics 2 |
| - | Subtract | #name of the column = metrics 1-metrics 2 |
| * | Multiply | #name of the column = metrics 1*metrics 2 |
| / | Divide | #name of the column = metrics 1/metrics 2 |
Table Settings
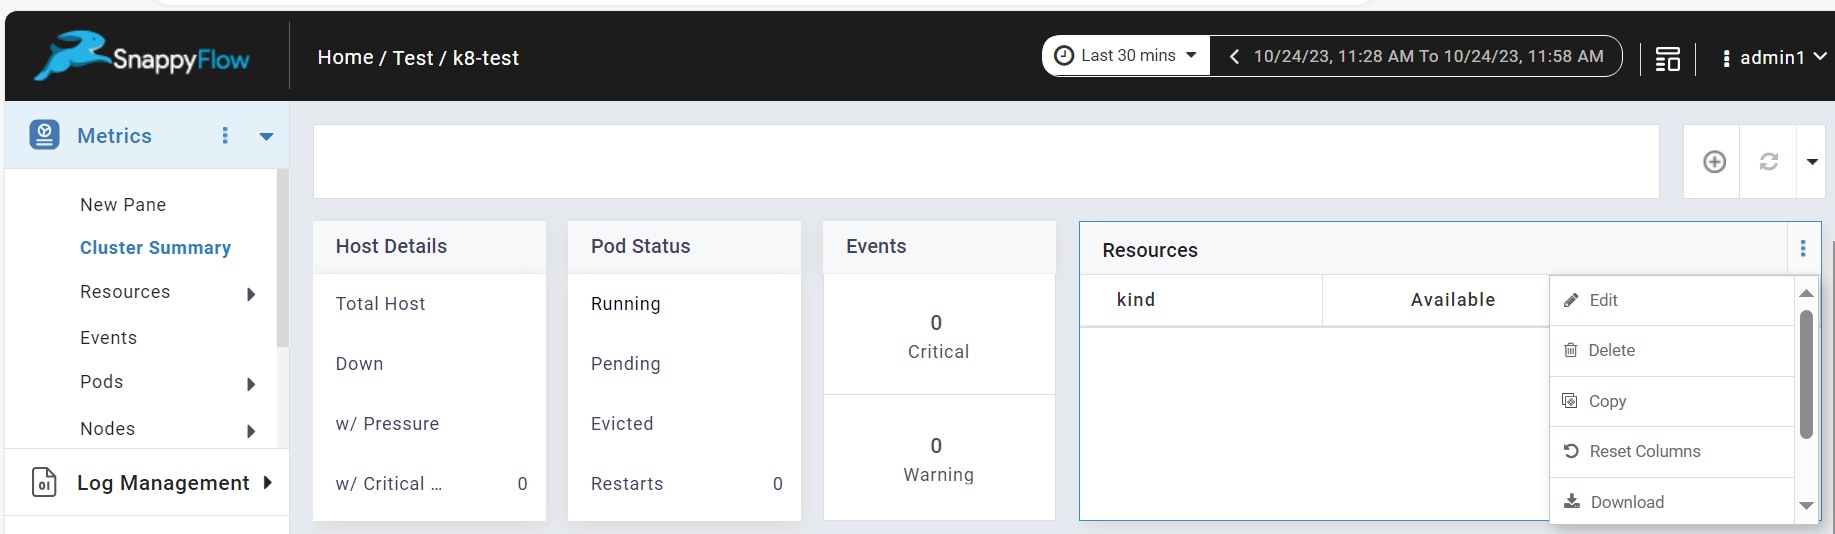
Click the Table Menu button to view the table settings.
- Edit - Enables you to customize the table
- Delete - Enables you to delete the table
- Copy - Enable you to copy the table
- Reset Columns - Enable you to reset the columns in the table
- Download - Enable you to download the table
The Edit option has 3 major tabs: Main, Advance Option, JSON Editor. You can use these 3 tabs to customize your table.
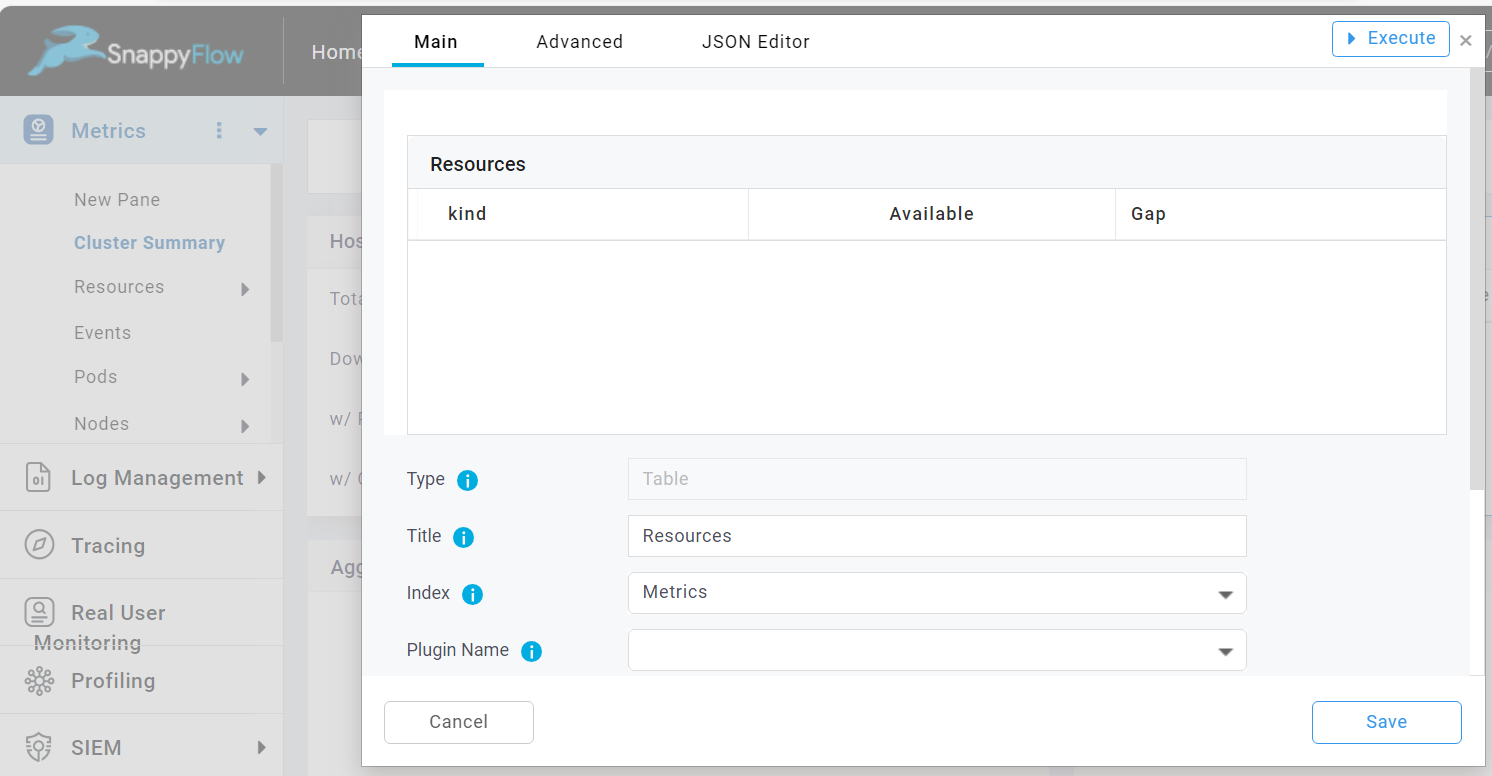
Main
The Main tab give you add basic information about the table as given below:
Title: Title of the table.
Index: Select an Index (Metrics, Log, Tracing ) from which data to be fetched for the table
Plugin Name: Select a plugin name to associate with the table. Example: Apache-access, linux, postgres.
Metrics: User can add any number of metrics using '+Add Metric' option provided as shown in the above image with appropriate aggregations
Table Key: Use this option if want to keep the table as an Aggregate table.
Advanced options
Size
It gives you the option to edit the size of the table. Give the width and height value to alter the size of the table.
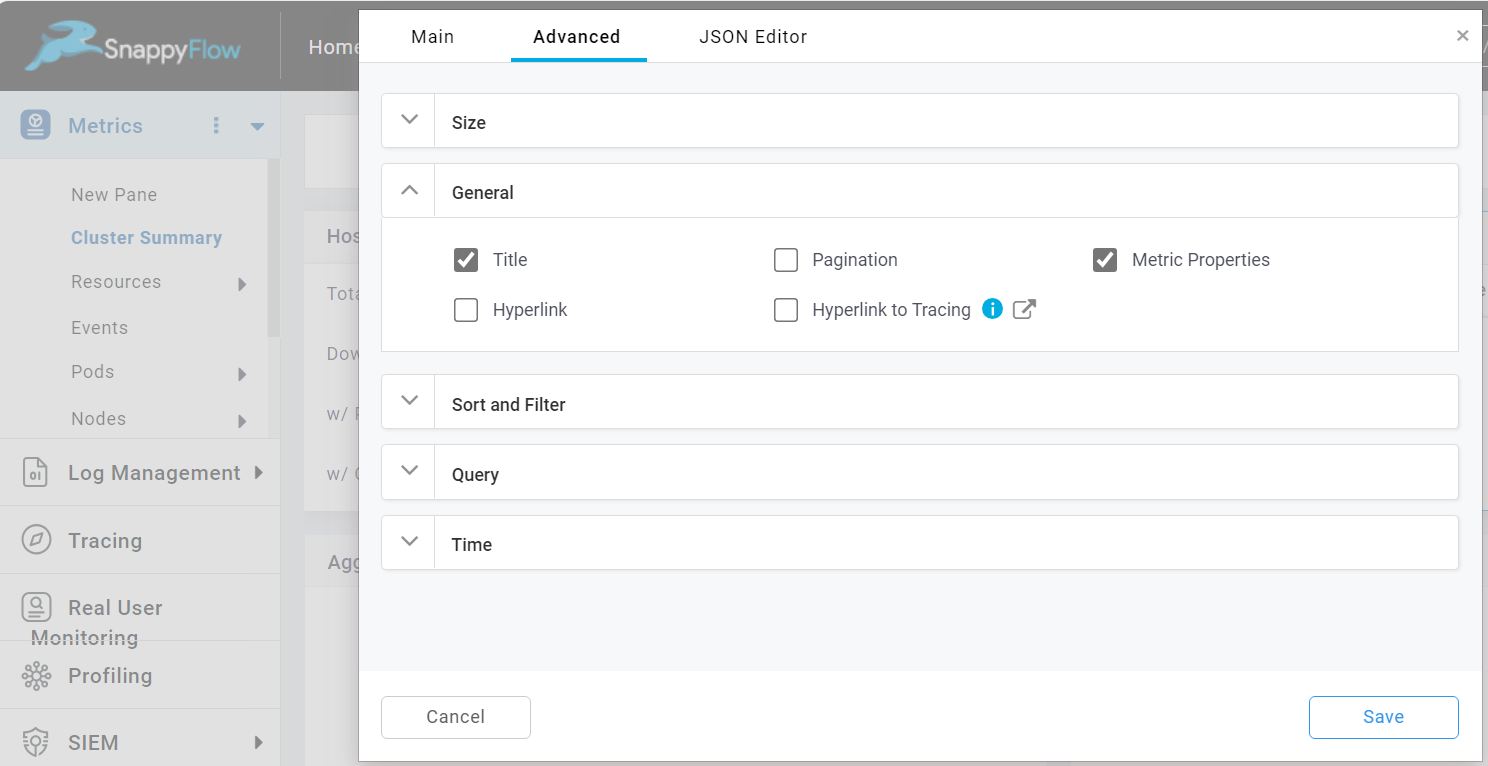
General
Title
The Title checkbox is checked by default. To hide the table title, simply uncheck the Title checkbox.
Pagination
Pagination is enabled by default. To disable the pagination, simply uncheck the Pagination checkbox.
Metric Properties
The metric Properties option enables you to customize the visualization of the data in table. The following values combinedly know as metric properties: Metric Filters, Decimal, Format, Color, Rate, Null values.
To enable the metric properties, check the Metric Properties checkbox.
Once the metric properties is enabled, you can view the list of metric properties in the JSON Editor tab.
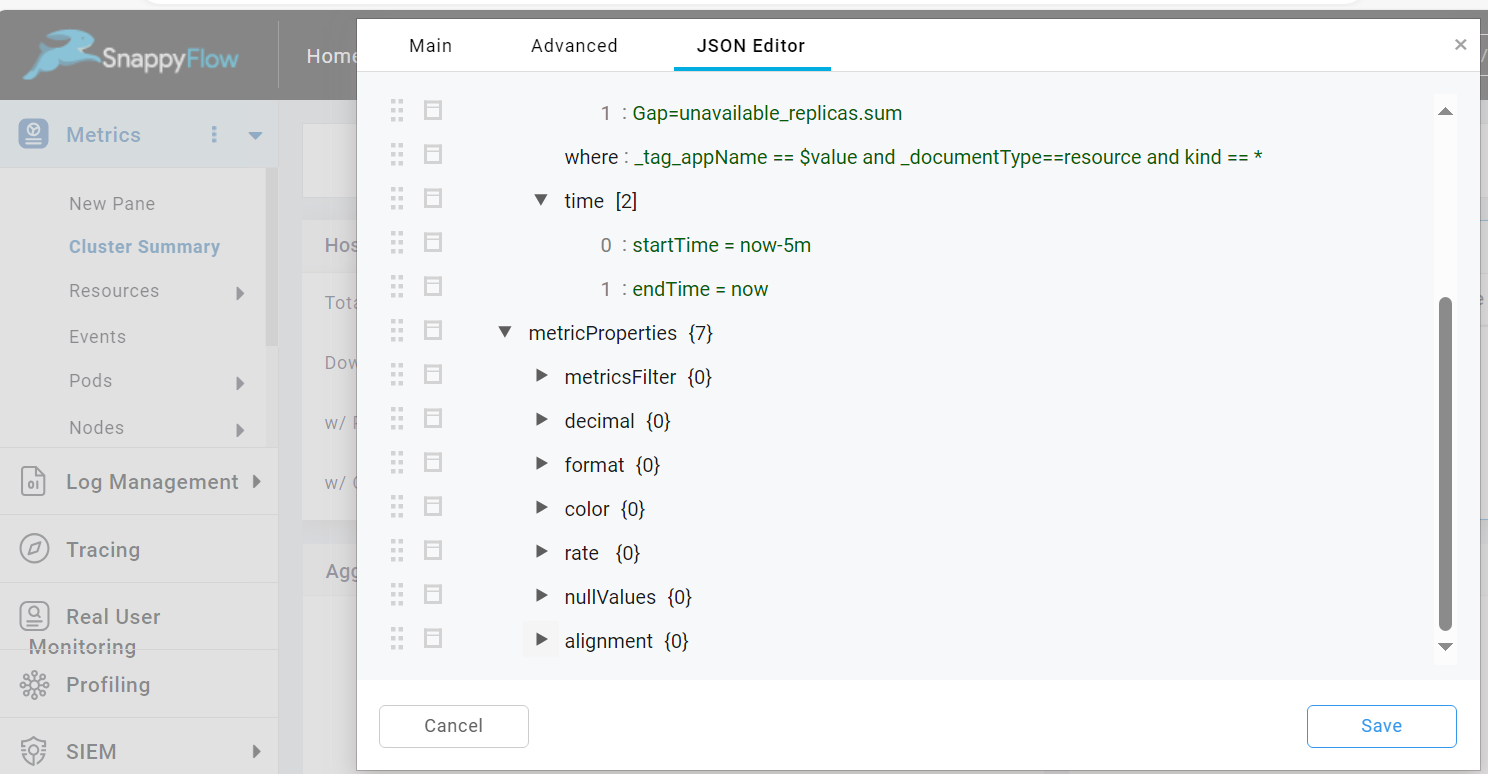
| Metric Properties | Description |
|---|---|
| metricsFilter | Used to display specified portions of the string in the component or to shorten the displayed string |
| decimal | By default, data is shown up to 1 decimal placeUser can override this setting by using this option |
| format | Format time field from epoch milliseconds/epoch seconds format to datetime, datetime(ms), datetime(us). |
| color | Display table cell with colors based on conditions |
| rate | Used to display the urate/unit rate of the metric in Table and Summary Box components |
| nullValues | Null Values are displayed as NA by defaultUse this option to override the default setting |
| alignment | Used to change the alignment of the column values. |
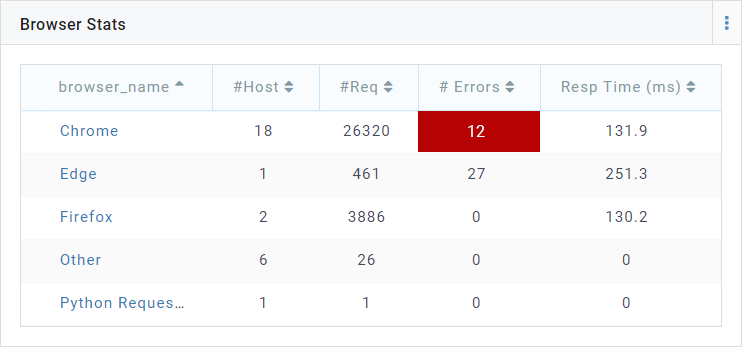
Example for Metric Property - Color
Consider you are computing the total number of 4XX and 5XX errors in the query and you want the color of the cell containing #Errors in red if the number of errors are GT 0.
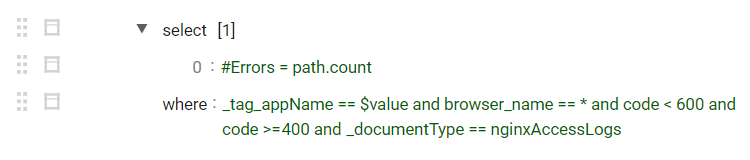
- Enable Metric Properties and in the JSON Editor add the condition as shown below for color
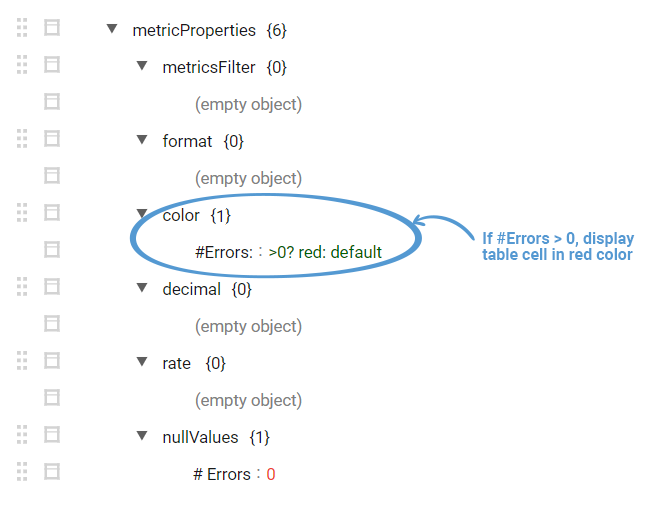
This will cause the color to rendered for the cell if #Errors is GT 0
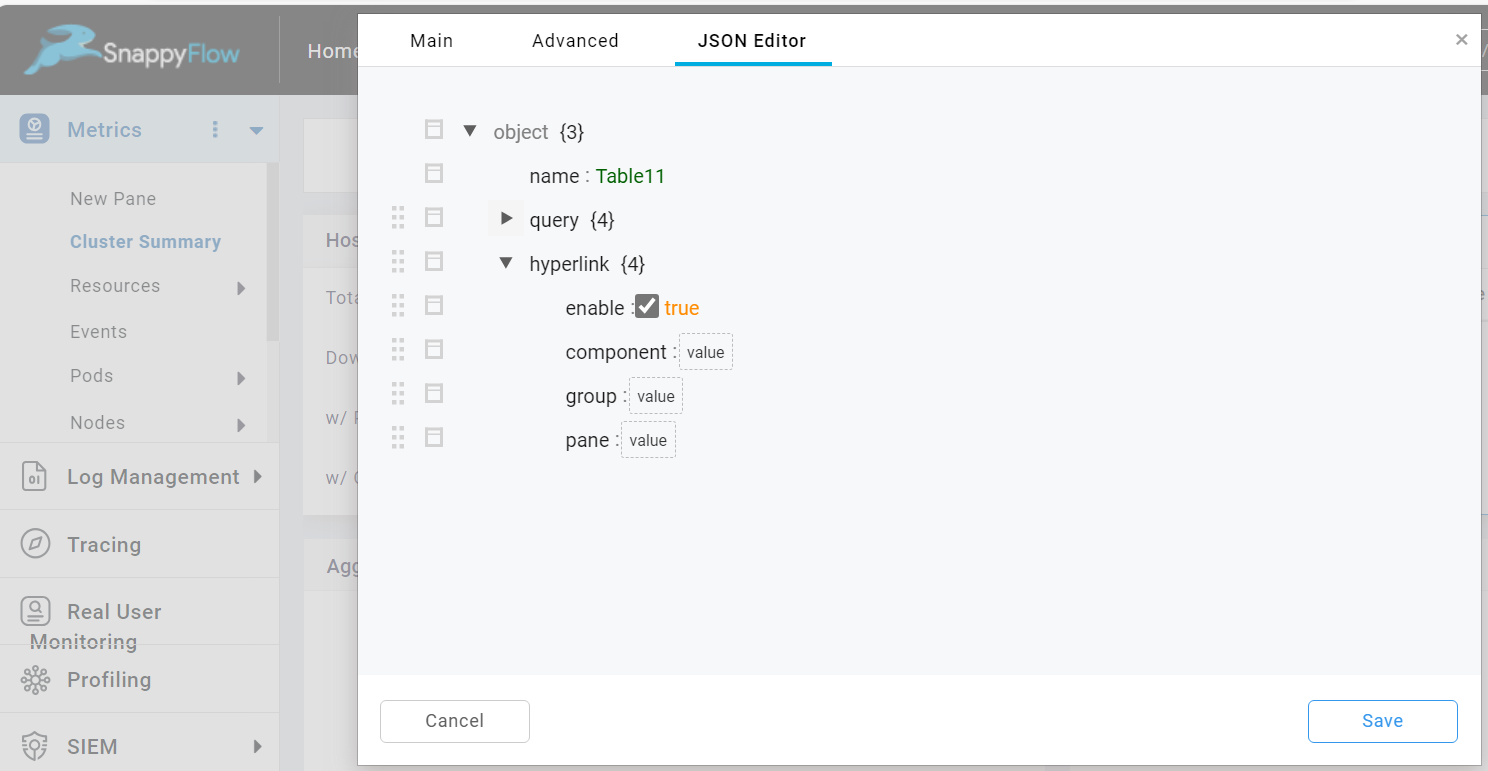
Hyperlink
The Hyperlink option allows you to navigate from a table to another pane. The value of the hyperlink are propagated to a dropdown of the pane.
To enable the hyperlink, check the Hyperlink checkbox.
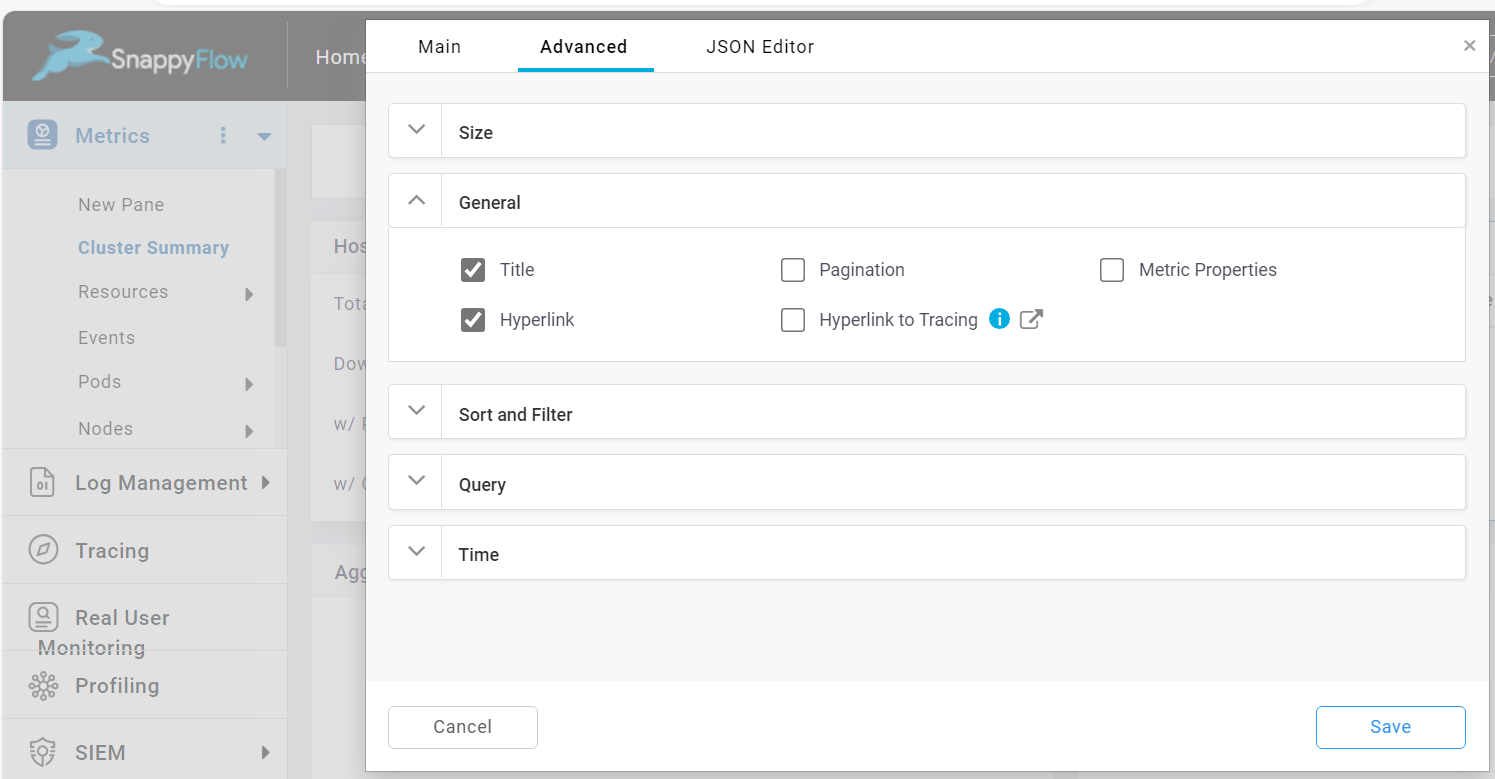
Once the hyperlink option is enabled, you can add a hyperlink to the table in the JSON Editor tab.
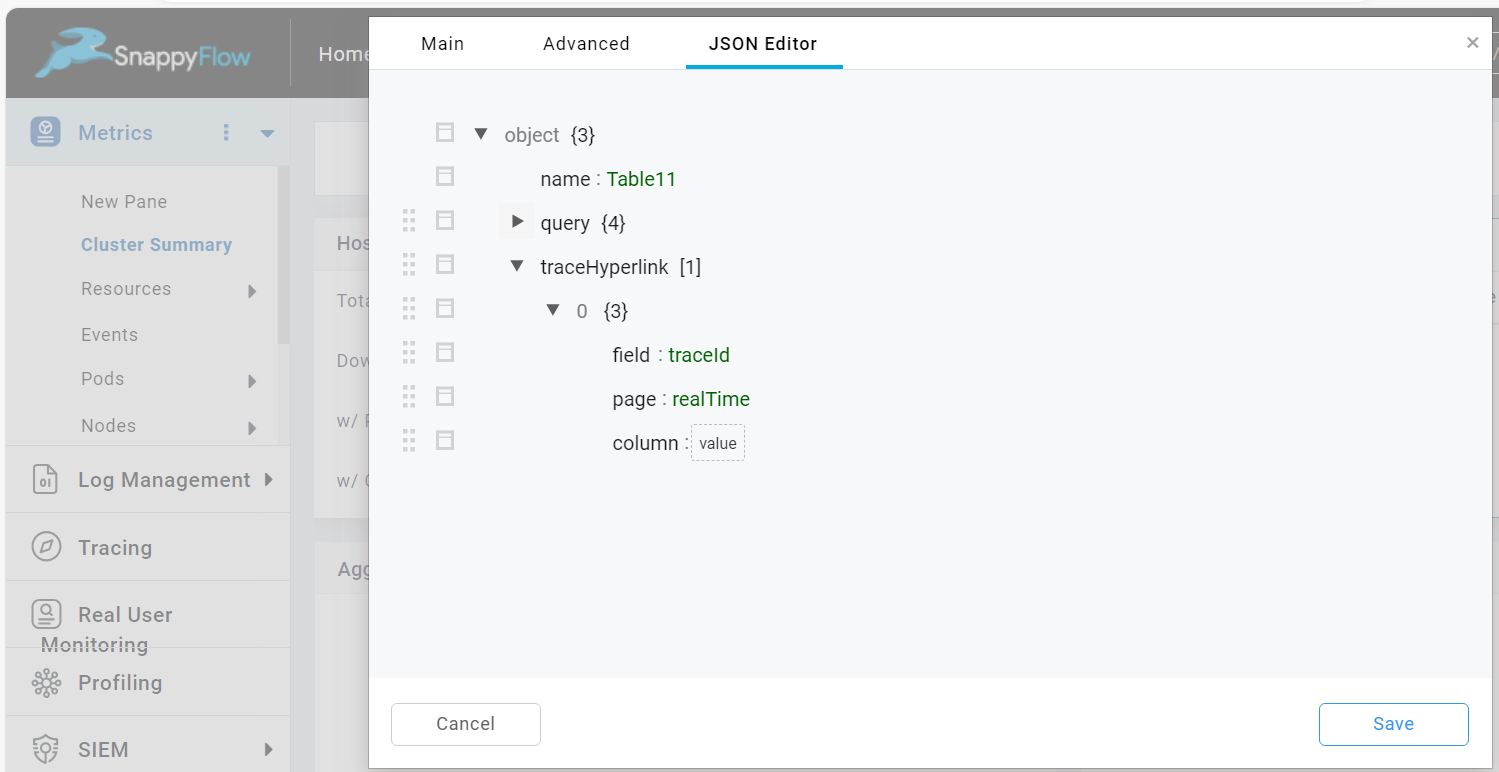
Hyperlink to Tracing
The Hyperlink to Tracing option enables you to go from the table component to the tracing section.
To enable the Hyperlink to Tracing, check the Hyperlink to Tracing checkbox.
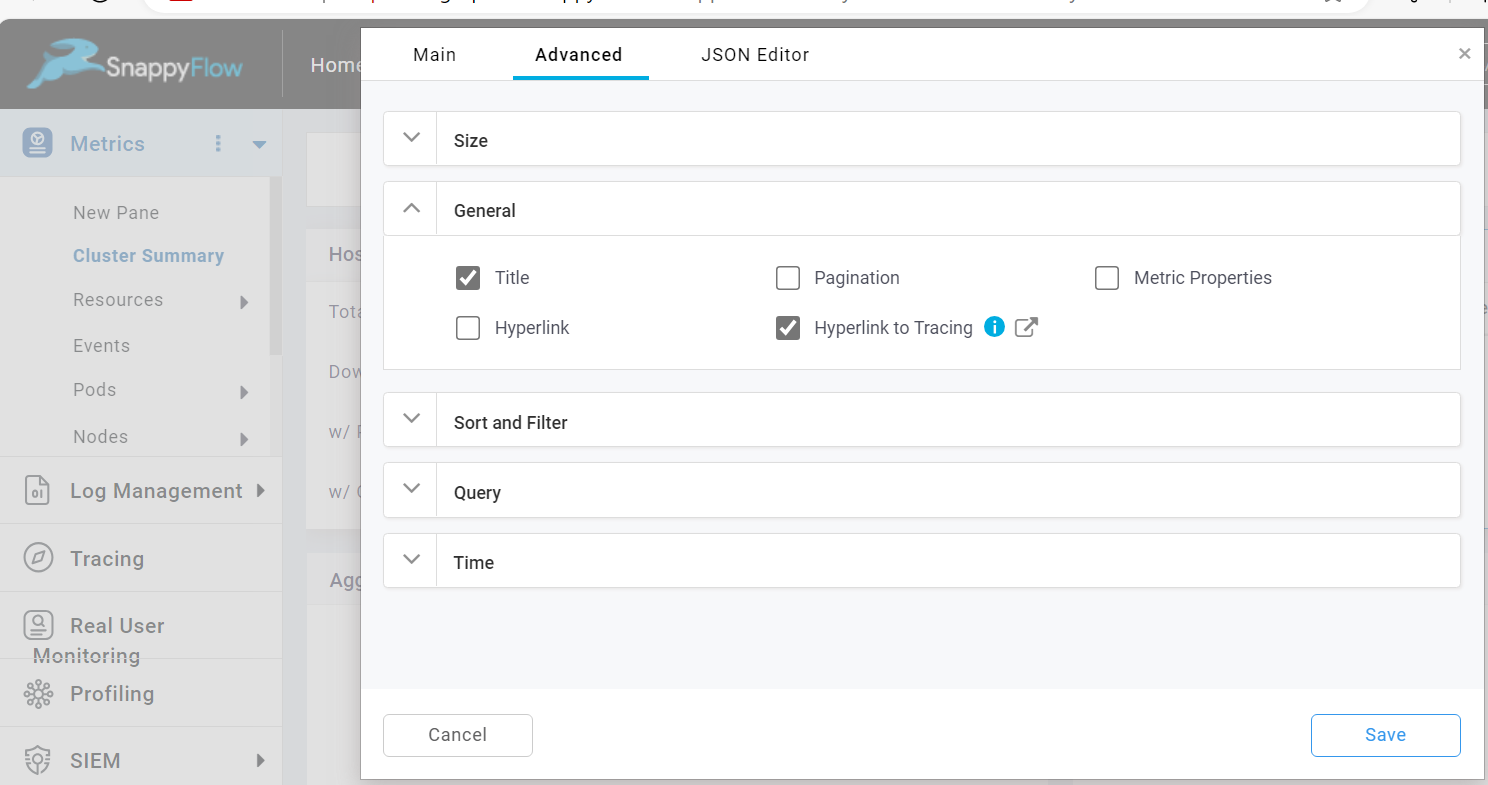
Once the Hyperlink to Tracing option is enabled, you can add the details in the JSON Editor tab.
Sort and Filter
Sorting
By default Sorting option is enabled and data in the table will be sorted in ascending order based on the table key.
Change Sort Order
This option is used to change the sort order. To change the sort order, do the following:
Check the
Change Sort Ordercheckbox.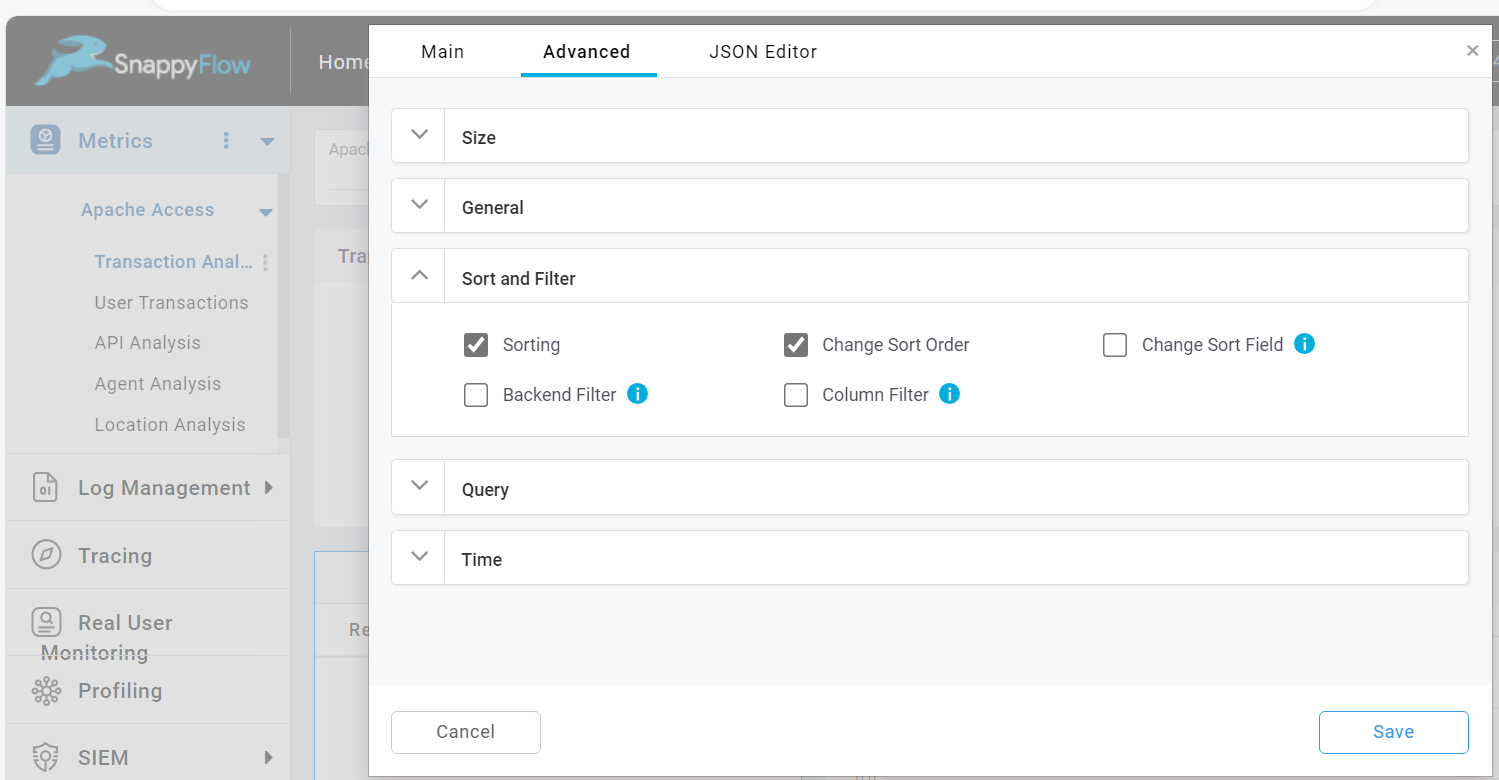
In the JSON Editor tab, go to the query section and change the value of
sortOrder.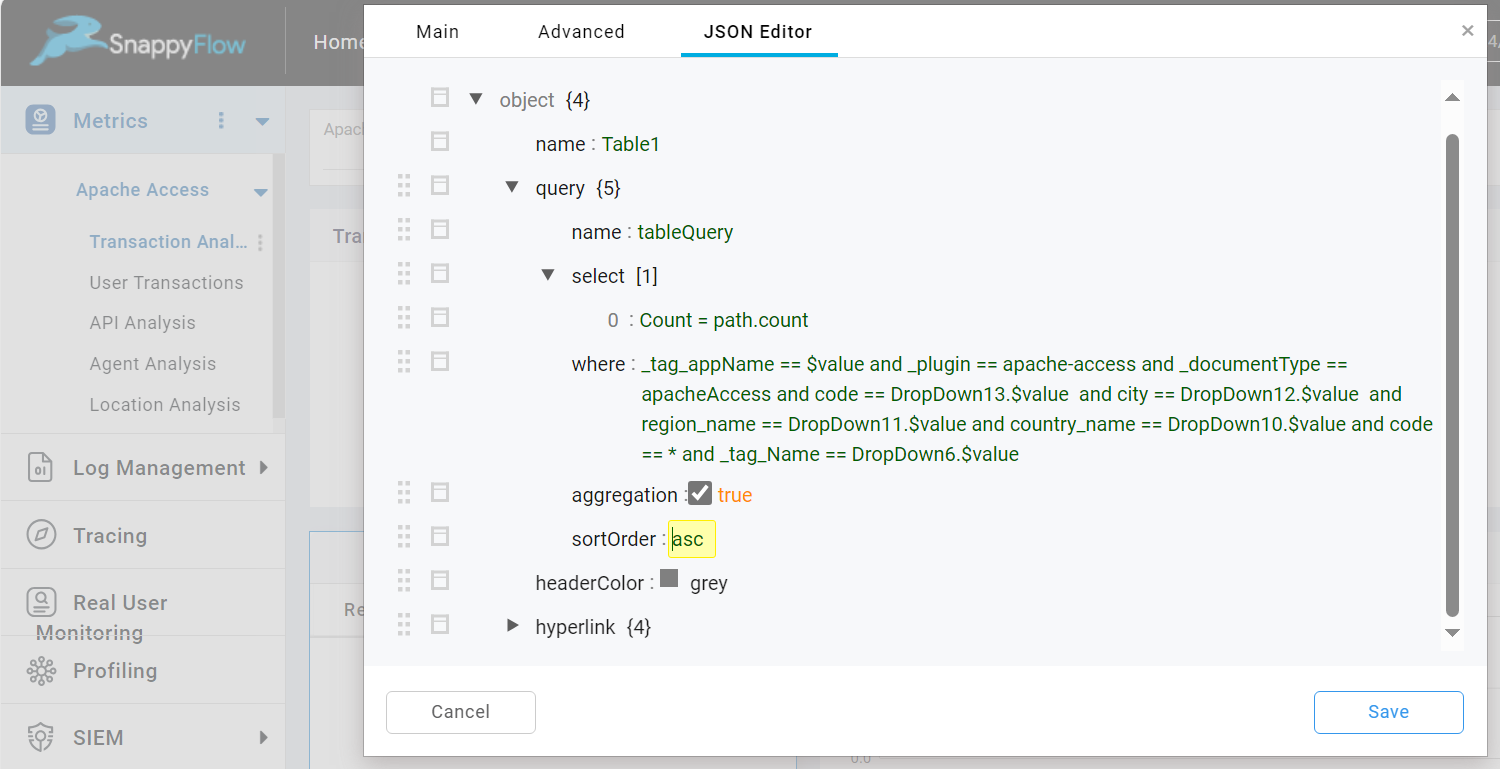
Change Sort Field
This option is used to change the sort field in the table. To change the sort field, do the following:
Check the
Change Sort Fieldcheckbox.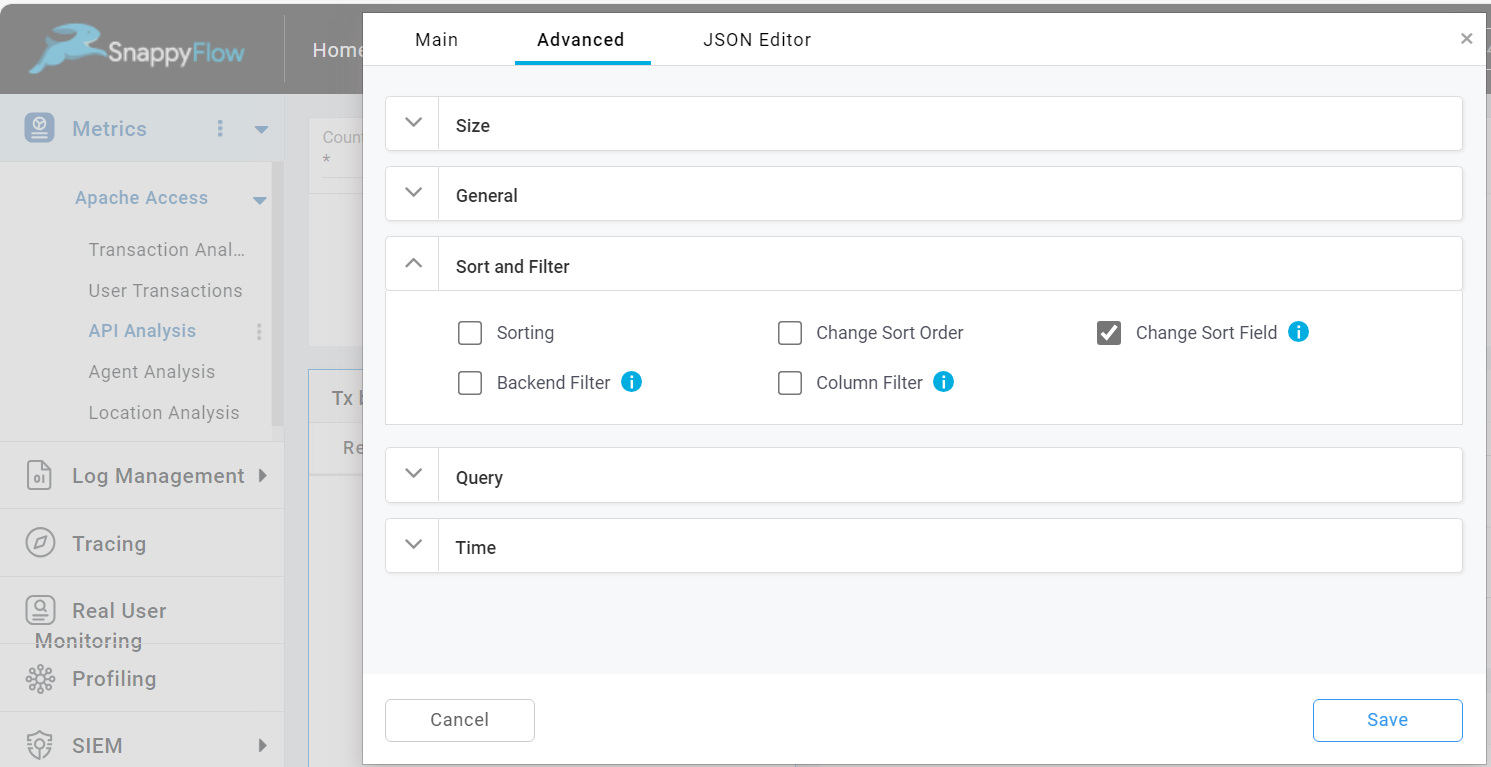
In the JSON Editor tab, go to the query section and change the value of
sortField.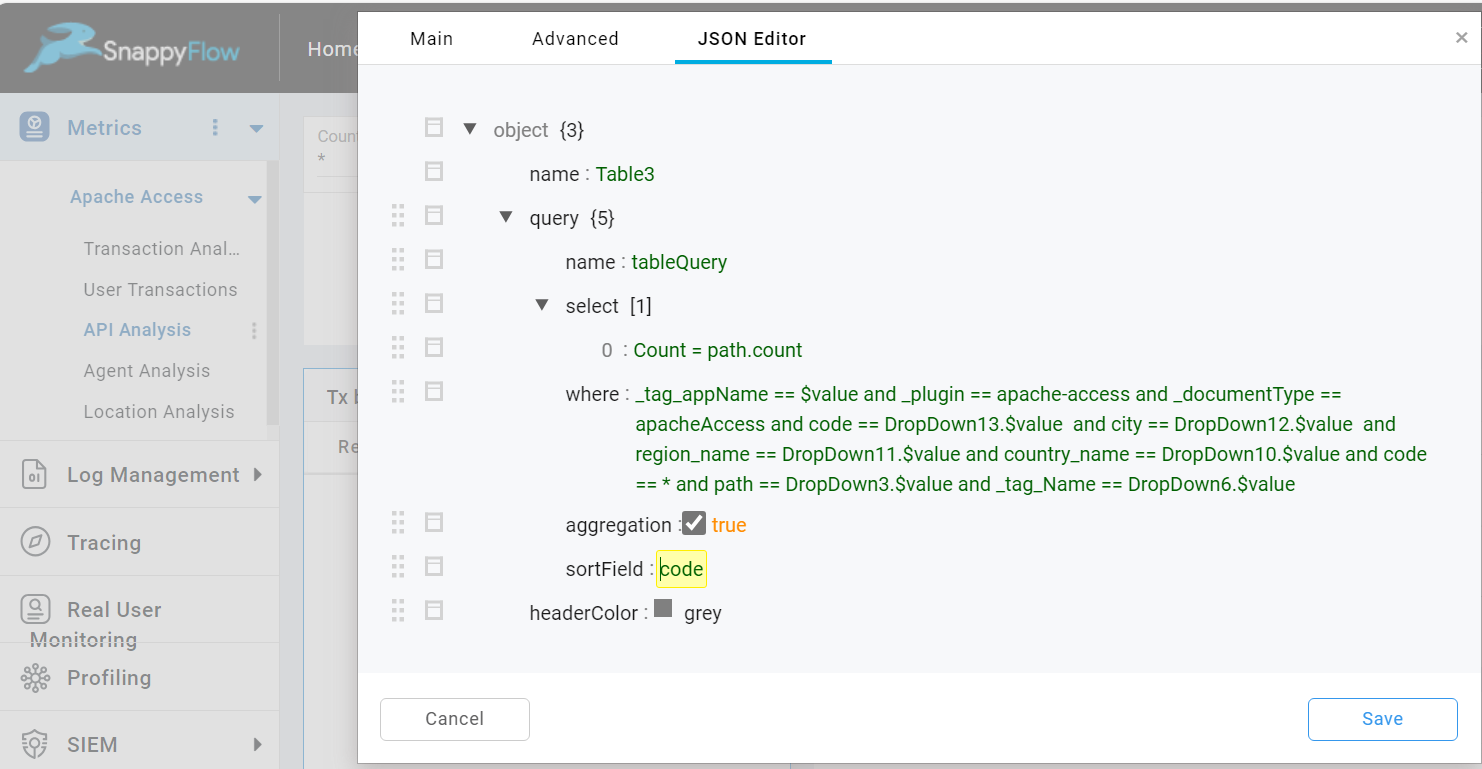
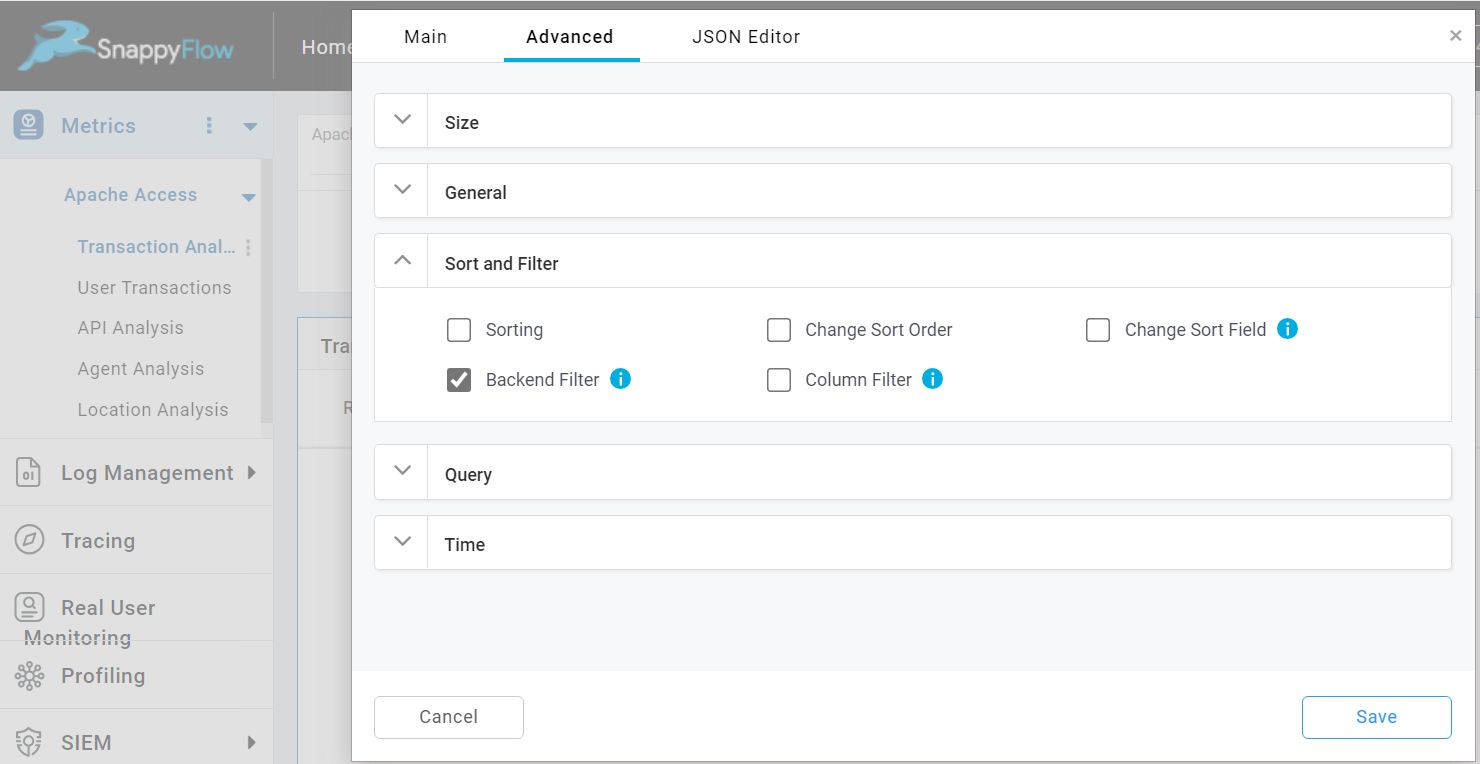
Backend Filter
In many cases, a query may return a large number of results and you will need to filter out the results from the database based on a certain values of a column.
By default, this option will be enable for the table. In case if it is disable, check the Backend Filter option to enable it.
To apply the filter parameters, select the filter icon. In the Filter column add the filter parameters.
- If combined query is used, filters can be applied only to table key.
- Filter cannot be applied to a variable that is a transformation of more than one metric.
Column Filter
The Column filter option enables you to filter the values at column level of the table.
Check the
Column Filtercheckbox.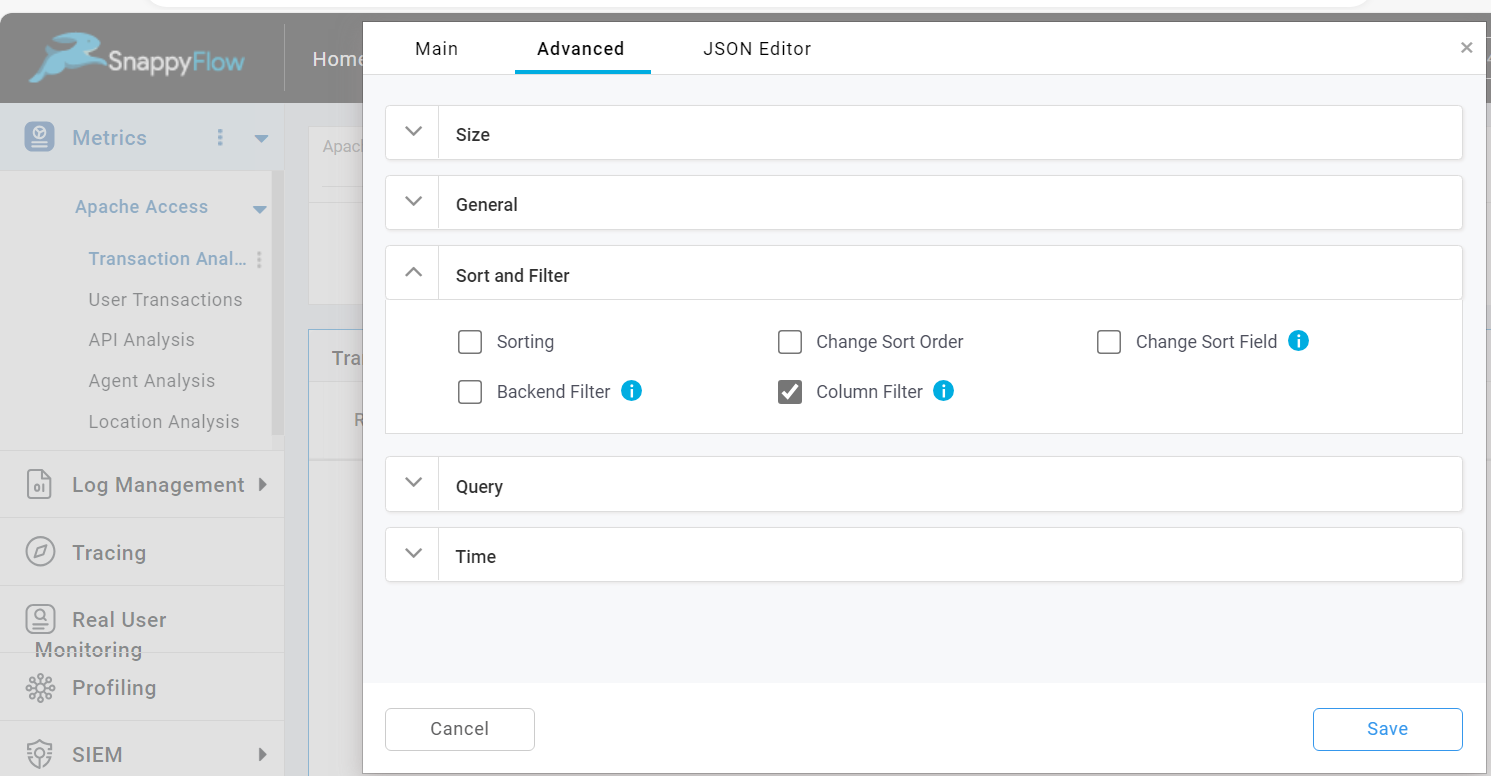
Filter icon will be added to every column in the table.
Click the filter icon of the required column and add the filter parameter.
Select the
Applybutton.
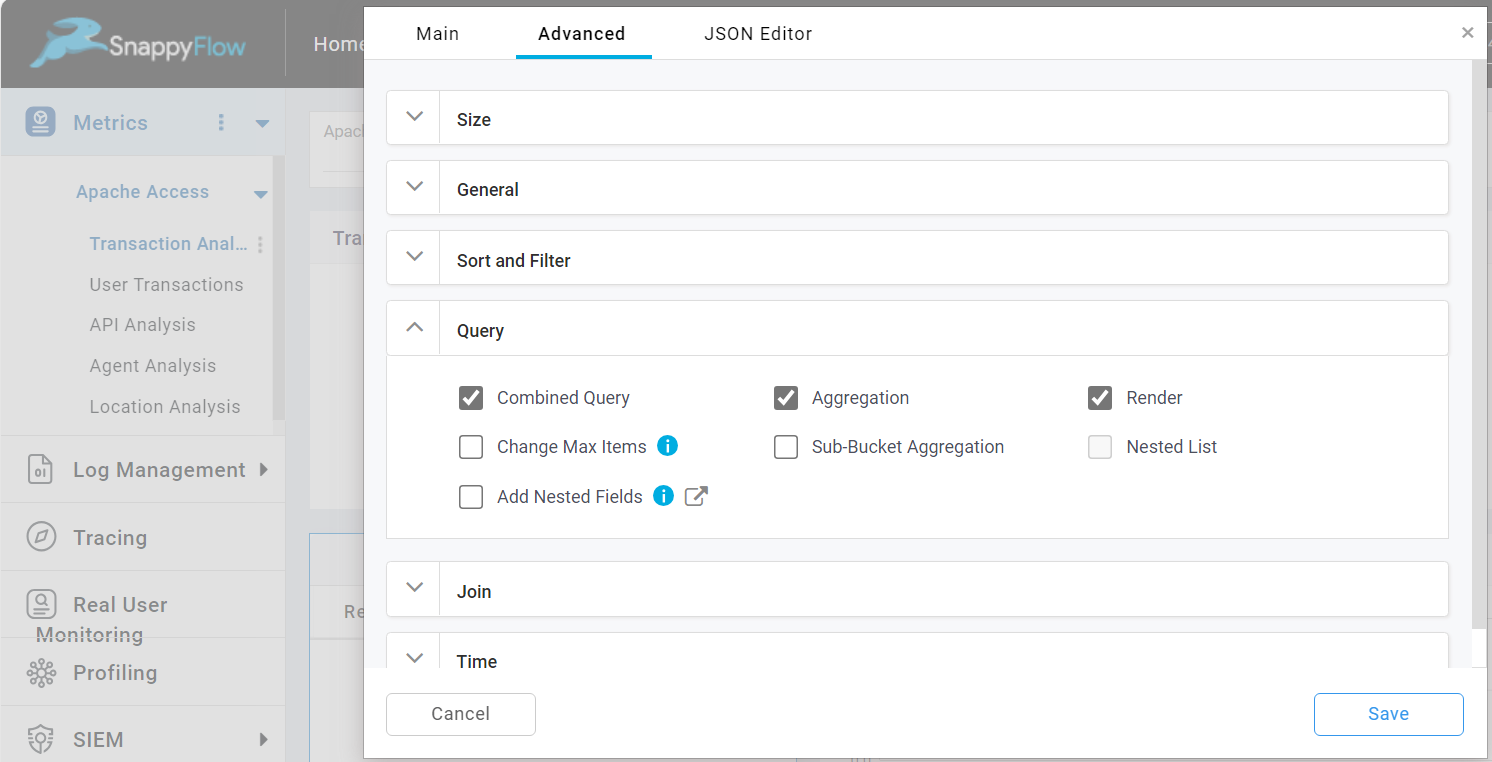
Query
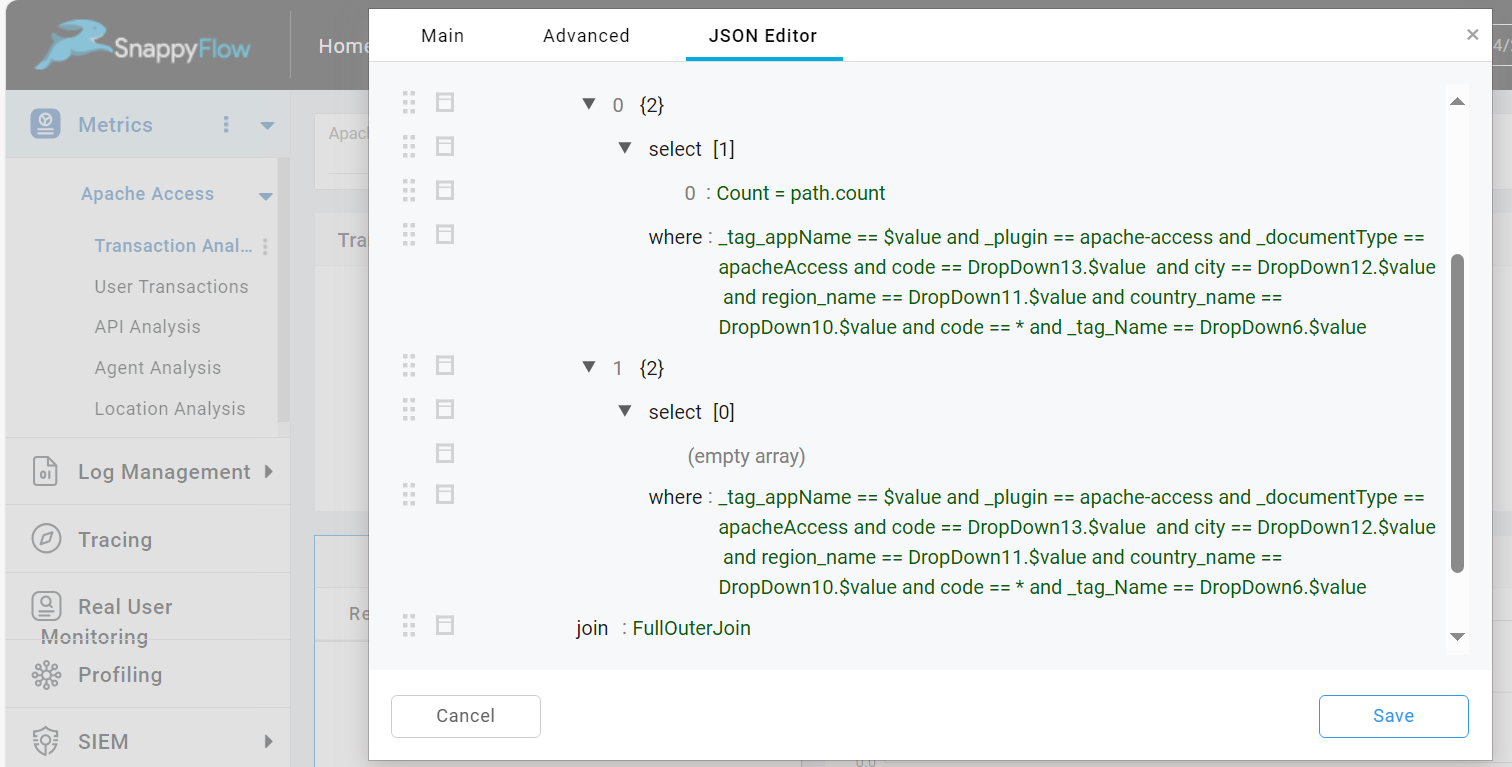
Combined Query
The Combined Query option allows you to add more than one queries for the table component.
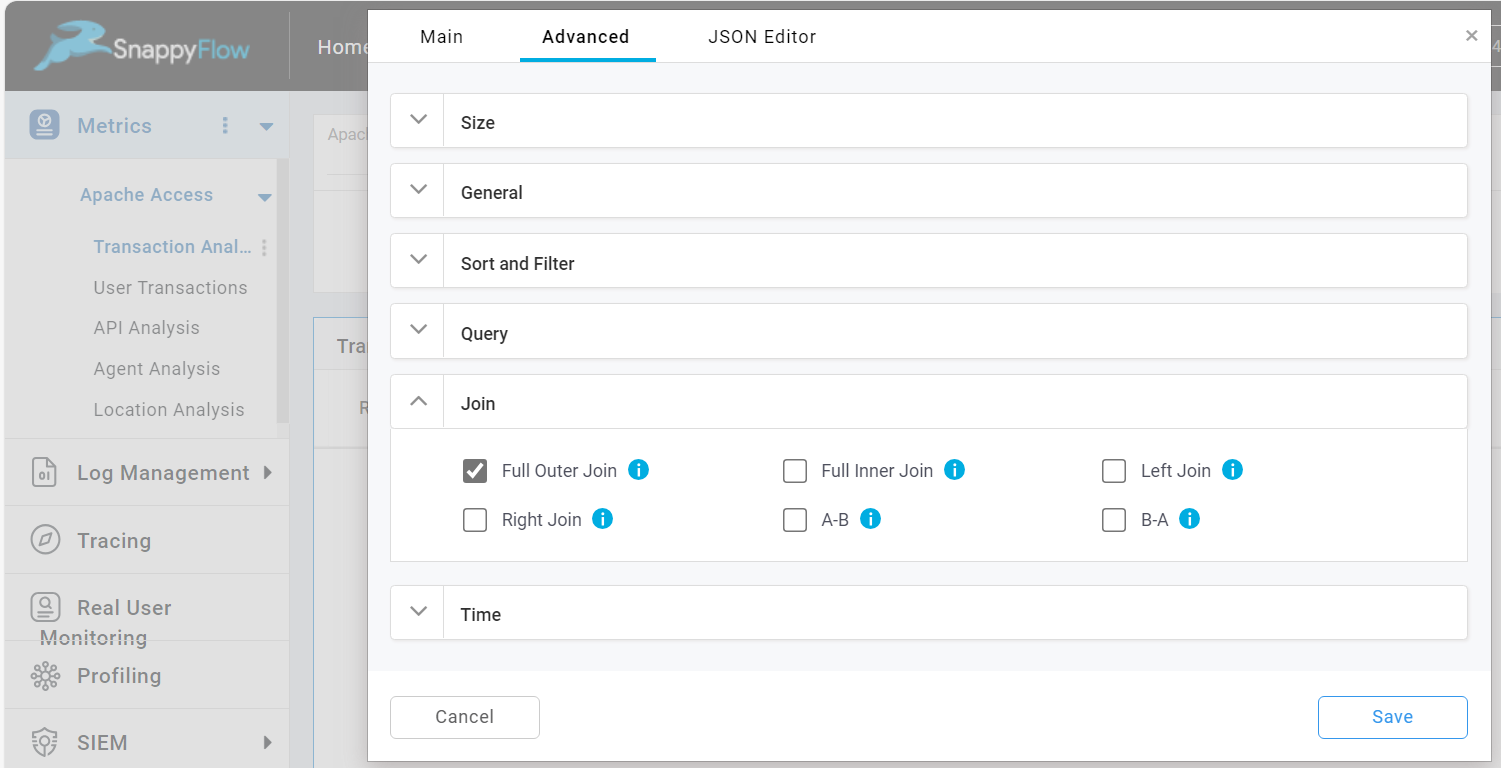
The following are the types of combined query:
Full Outer Join: Returns all records when there is a match in all the queries (union of all queries)
Full Inner Join : Returns only matching records from all queries (intersection of all queries)
Left Join : Returns records for the keys present in the first query
Right Join : Returns records for the keys present in the last query
A-B : Returns records for the keys present only in the first query
B-A : Returns records for the keys present only in the last query
To performed combined query, do the following:
Check the
Combined Querycheckbox.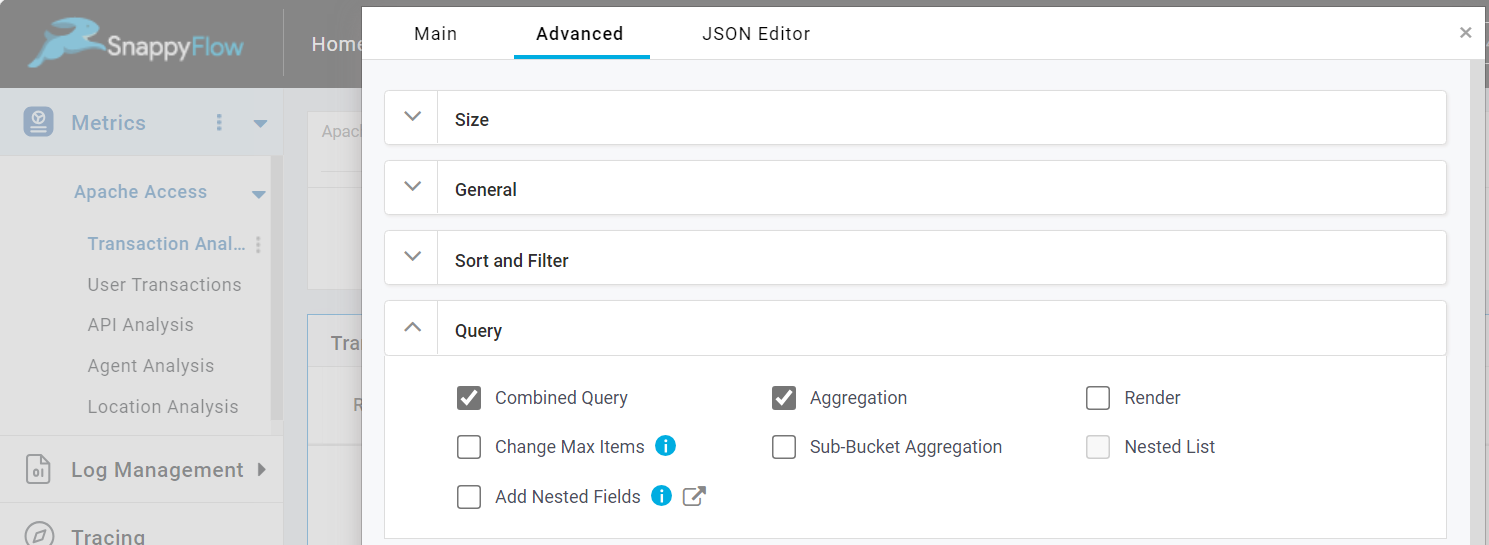
Once the combined query is enabled, the Join section will open.
In the Join section, select a Join type.
Now go to the JSON Editor and add the query.
Aggregation
By default, Aggregation option is enabled. If you uncheck this option, the table will be converted in to non-aggregation table.
Render
Render option is useful when using combined query for tables. It changes the order of rendering metrics when combined query is used and It also collects number of metrics, transform the metrics and render only a subset of the collected metrics.
To enable this, check the Render checkbox.
Change Max Items
The Change Max Items option allows you to modify maximum number of items you want to get for the query created. To enable this option check the Change Max Item checkbox.
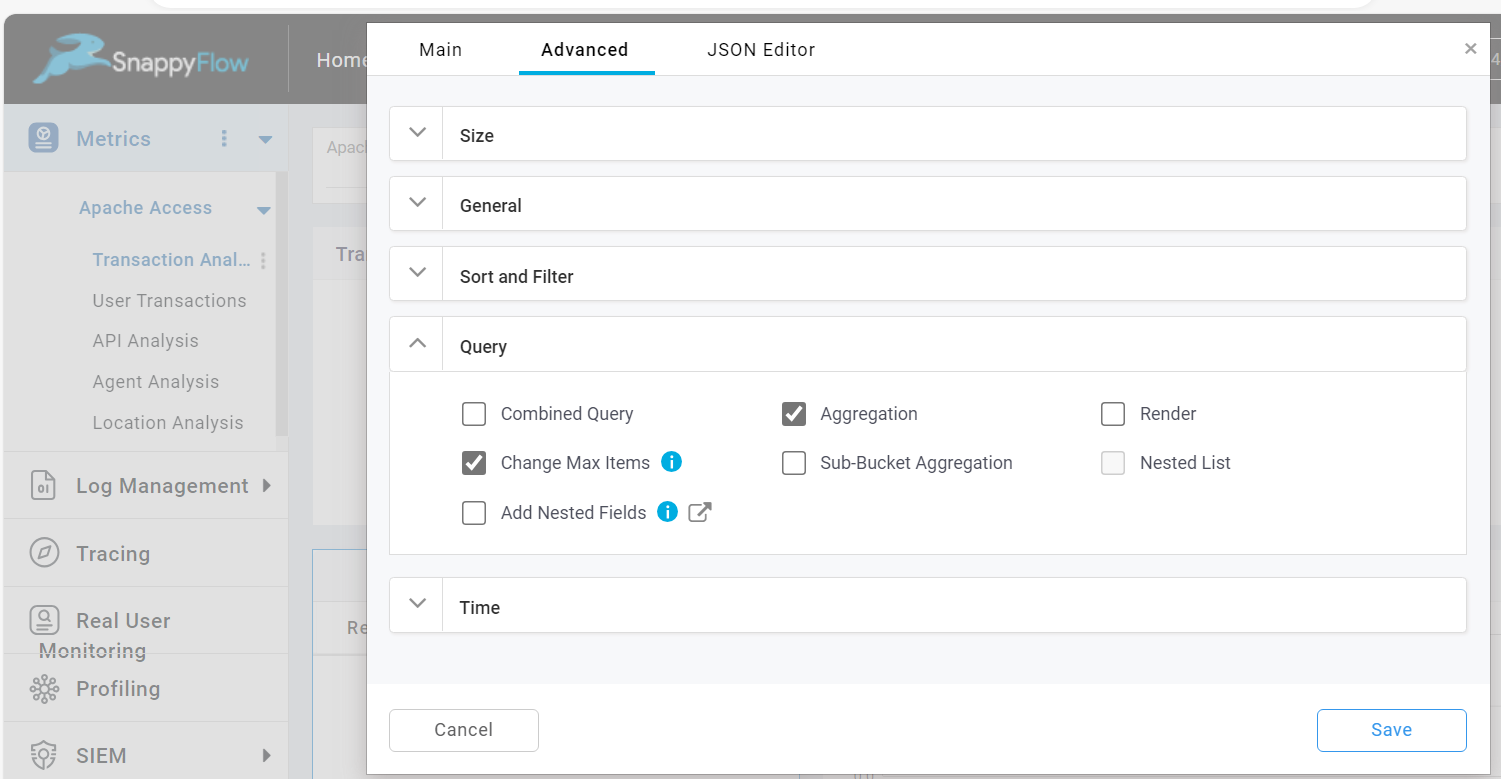
When this option is enabled, maxItems section will be added in JSON editor and you can edit the number of max items.
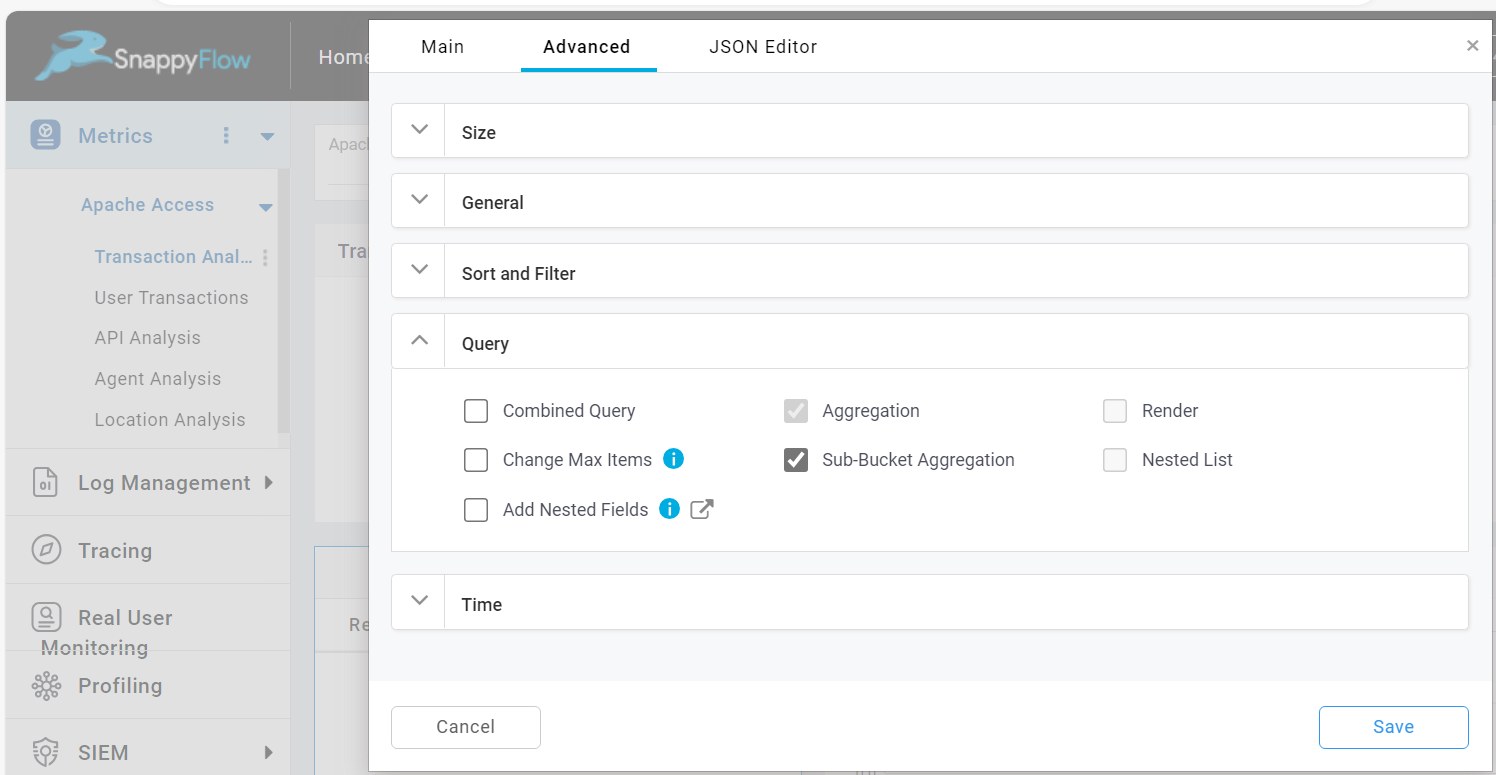
Sub-Bucket Aggregation
Sub-Bucket Aggregation option can be enabled when second level of aggregation is required. To enable this option check the Sub-Bucket Aggregation checkbox.
Example:
For a each plugin there can be multiple _documentType, when user want to view all the documentTypes under each plugin, then in JSON Editor where clause user should mention -plugin == * and in subBucket user need to add _documentType
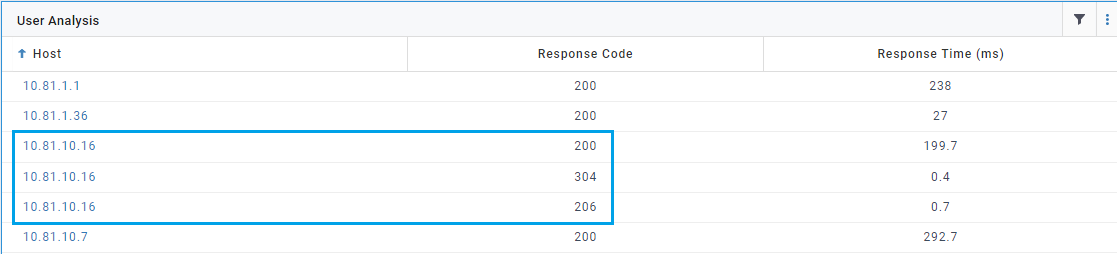
- Consider the below example in where clause host == * and subBucket : code
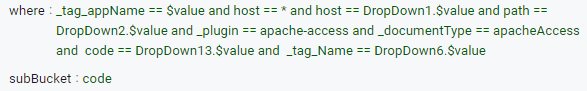
- So in the result table below for each host all the response codes are listed so combination of host + code will form one row in the table
Nested List
The Nested List option allows you to fetch the latest list of items from nested list from ES data. This option is used when there is nested list in the metric data. To enable this option check the Nested List checkbox.
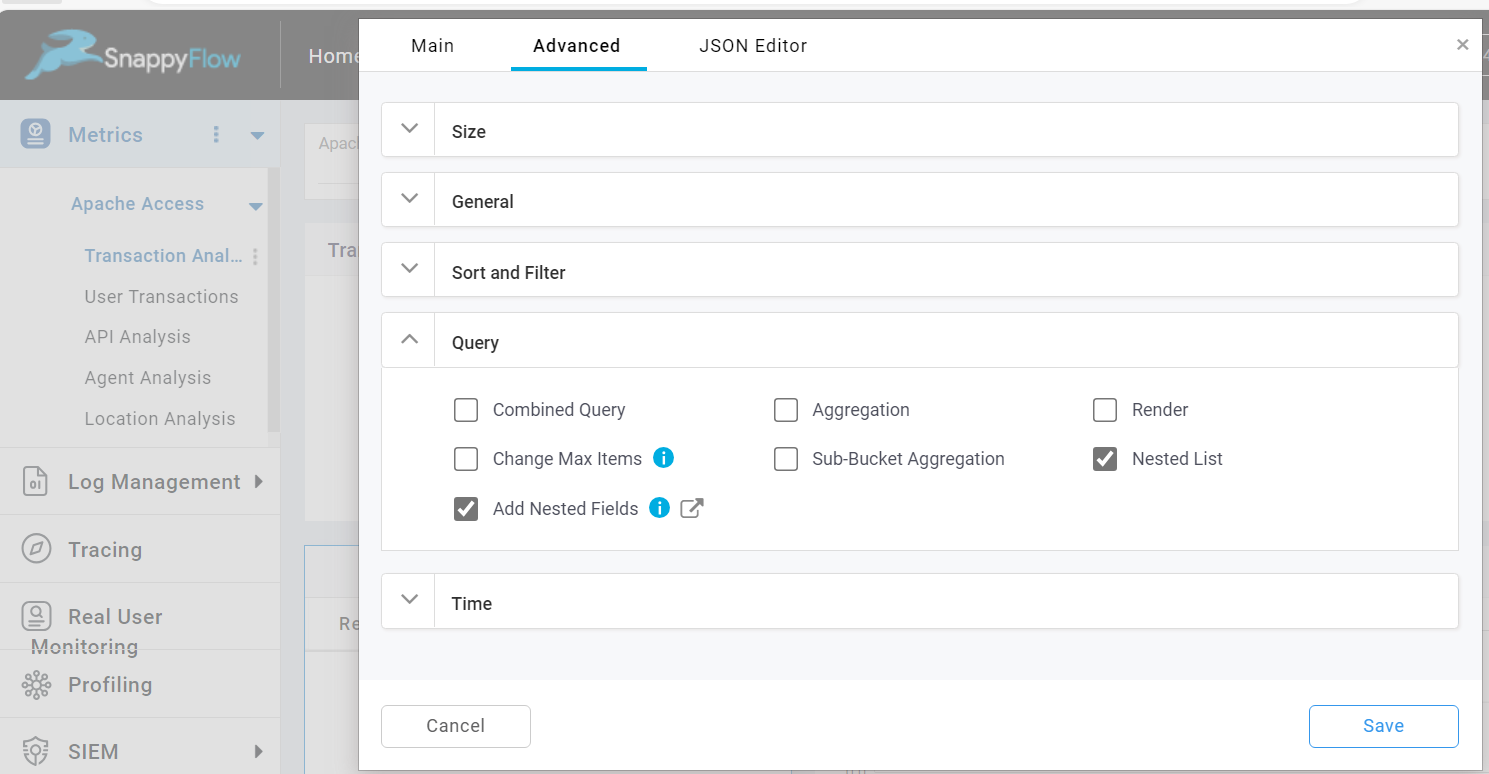
This is allowed only when aggregation option is disabled and Add Nested Fields option is enabled.
Add Nested Fields
The Add Nested Field option is used to add or change name of the Nested Field in the metric data. To enable this option check the Add Nested Fields checkbox.
Then go to the JSON Editor and add or change the name of the Nested Field.
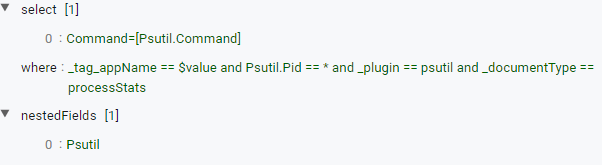
Keep the Nested Field option enabled.
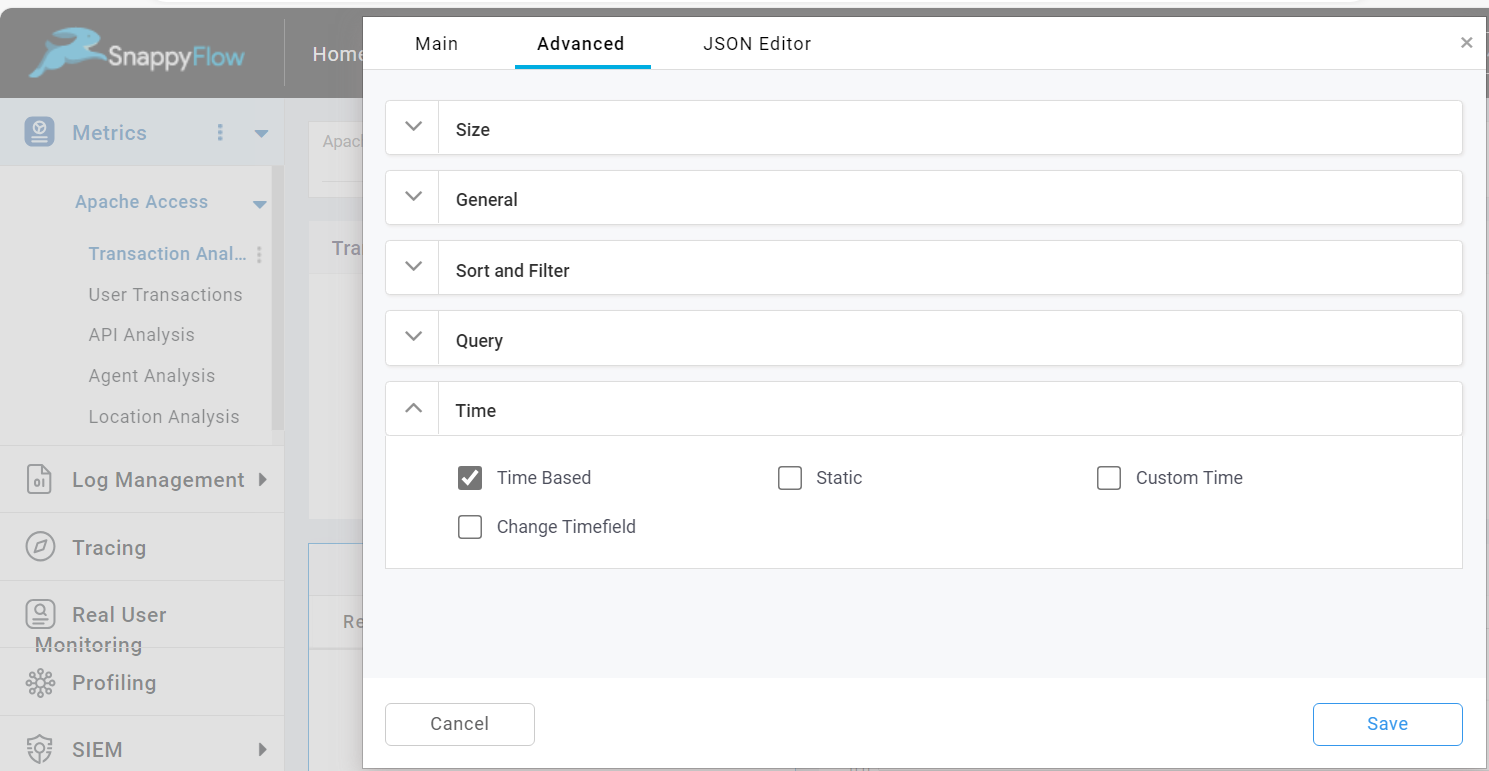
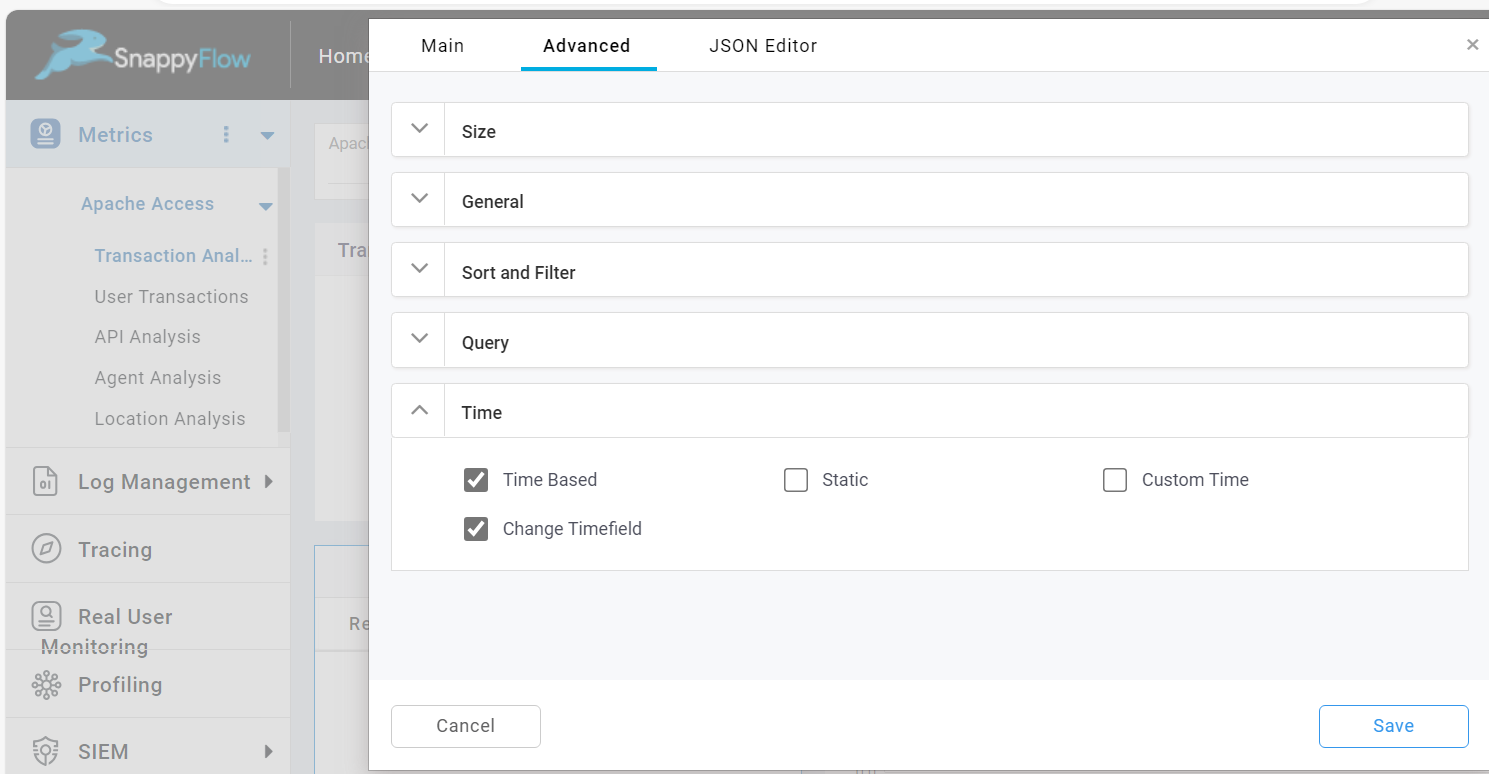
Time
Time Based
The Time based option is enabled by default. This option allows you to include time filter in the query and time will be considered from dashboard time.
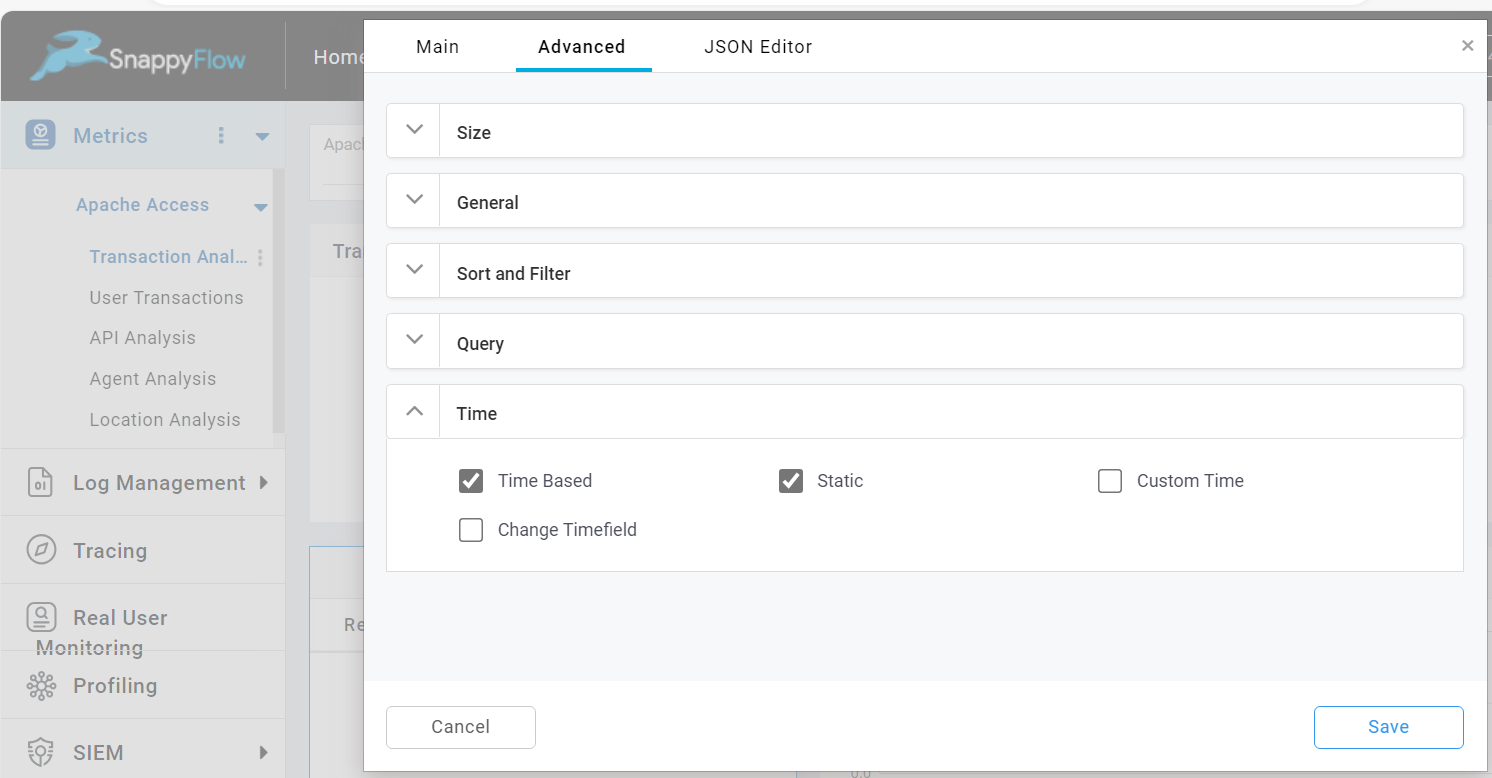
Static
The Static option disable the collection of new data for each refresh cycle. To enable this option check the Static checkbox.
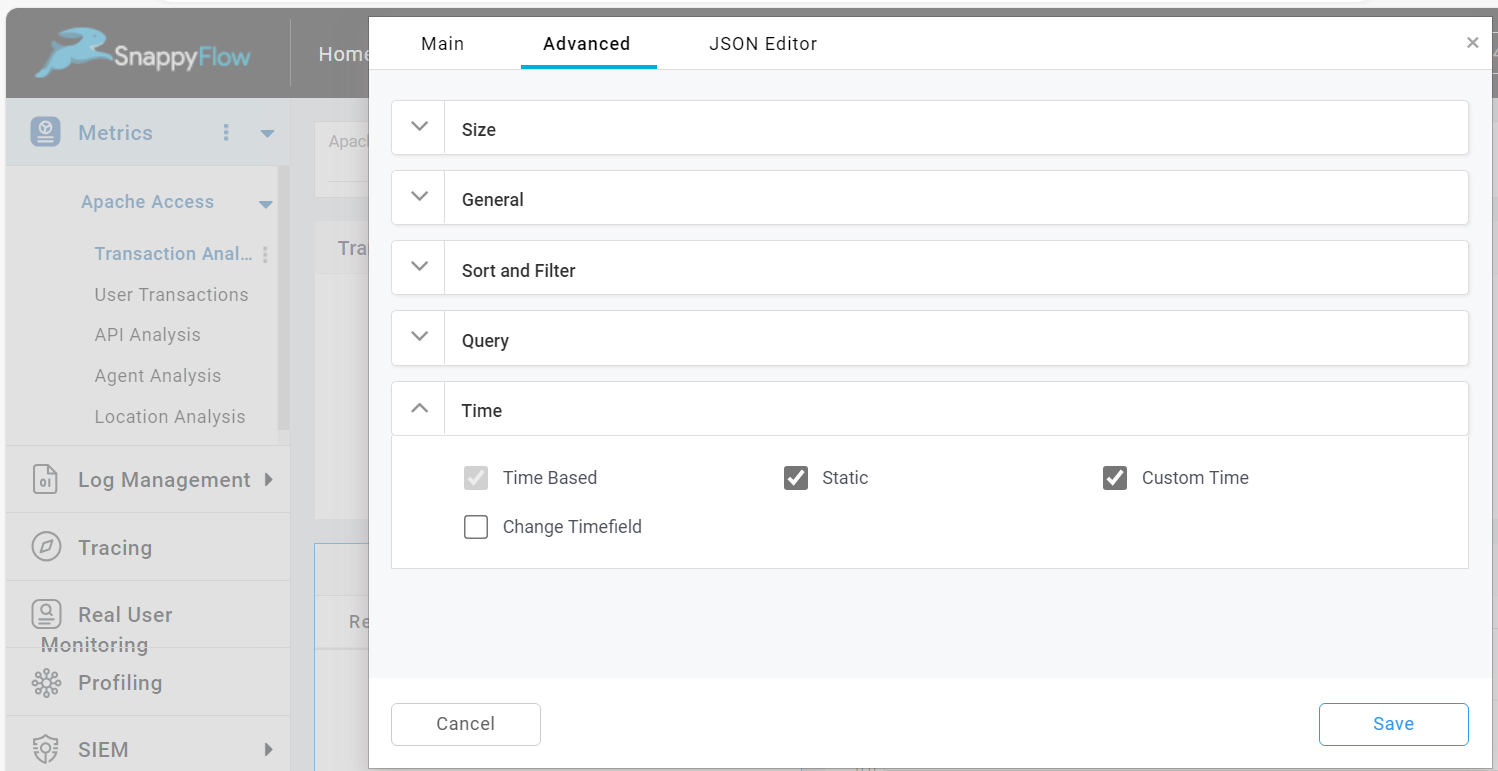
Custom Time
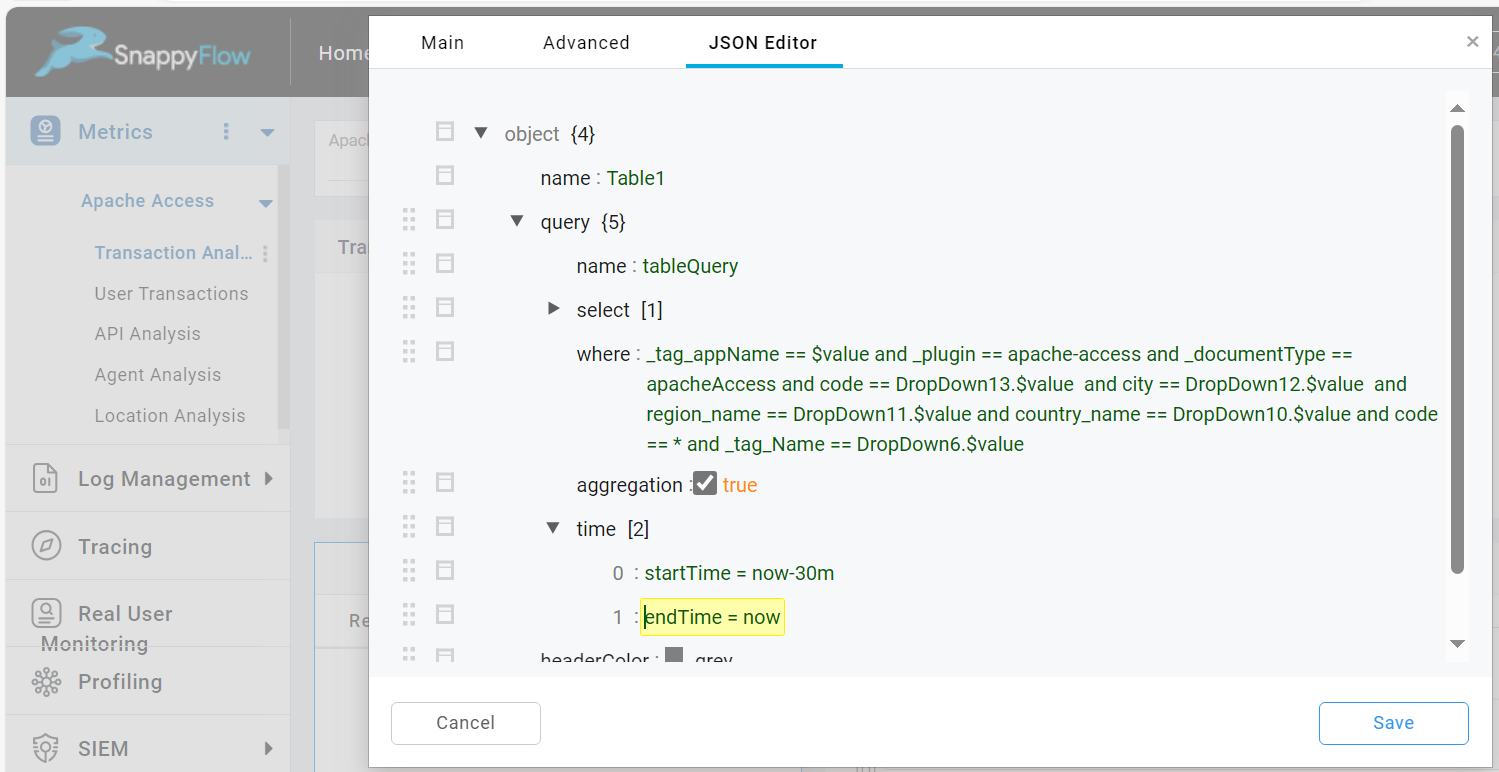
The Custom Time option allows you to add custom time value in the query in JSON Editor. To enable this option check the Custom Time checkbox.
Then go to the JSON Editor, add values for stratTime and endTime. Format of startTime is now-time.
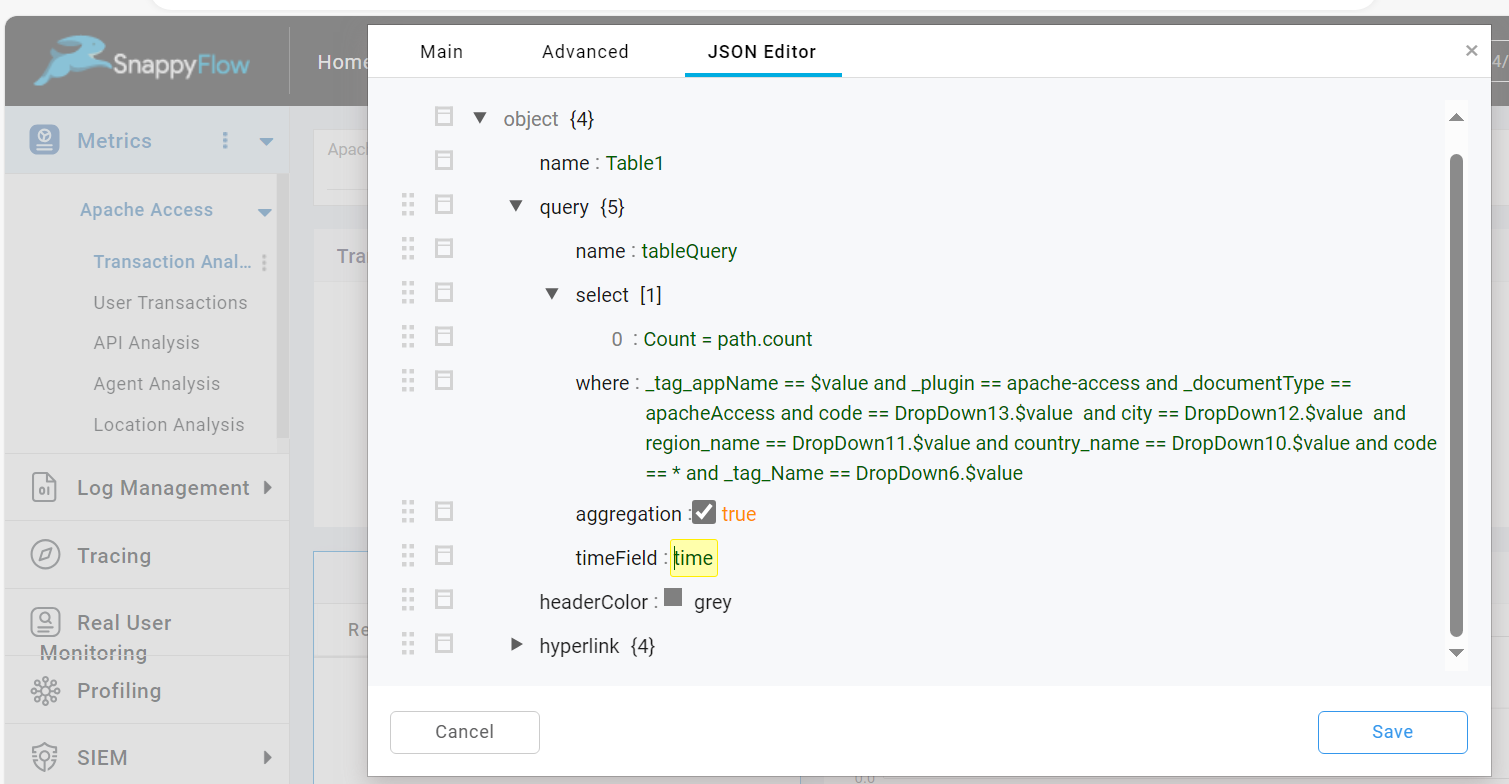
Change Timefield
The Change Time allows you to change the name of the time field in the query while fetching from Elastic Search (ES) data. To enable this option check the Change Timefield checkbox.
Then go to the JSON Editor and change the value of the timeField.