Monitor Ruby Application in Docker
Prerequisite
Profile Id
Follow the below steps to get the Profile Id from the Profiles section.
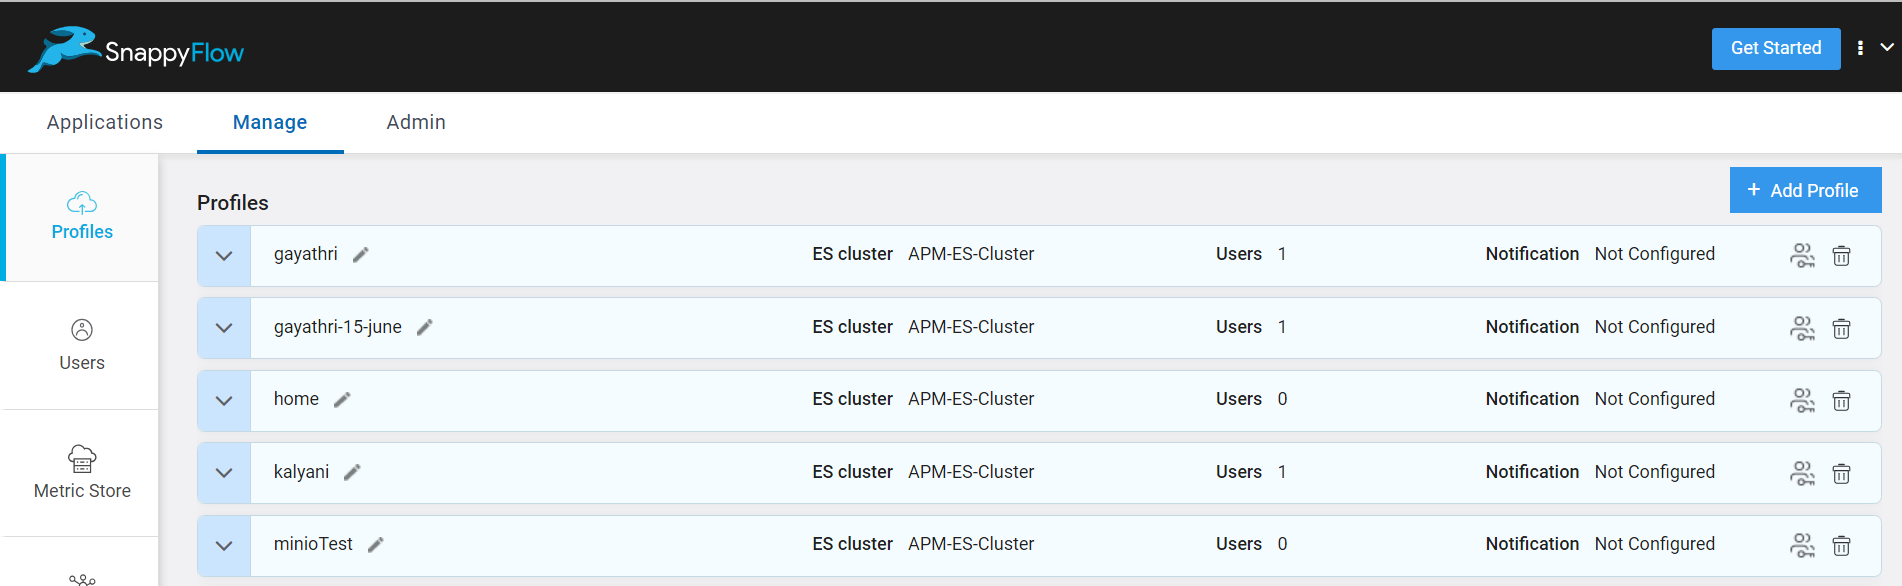
To access the Profiles section in SnappyFlow, navigate to the Manage tab and click on your profile.
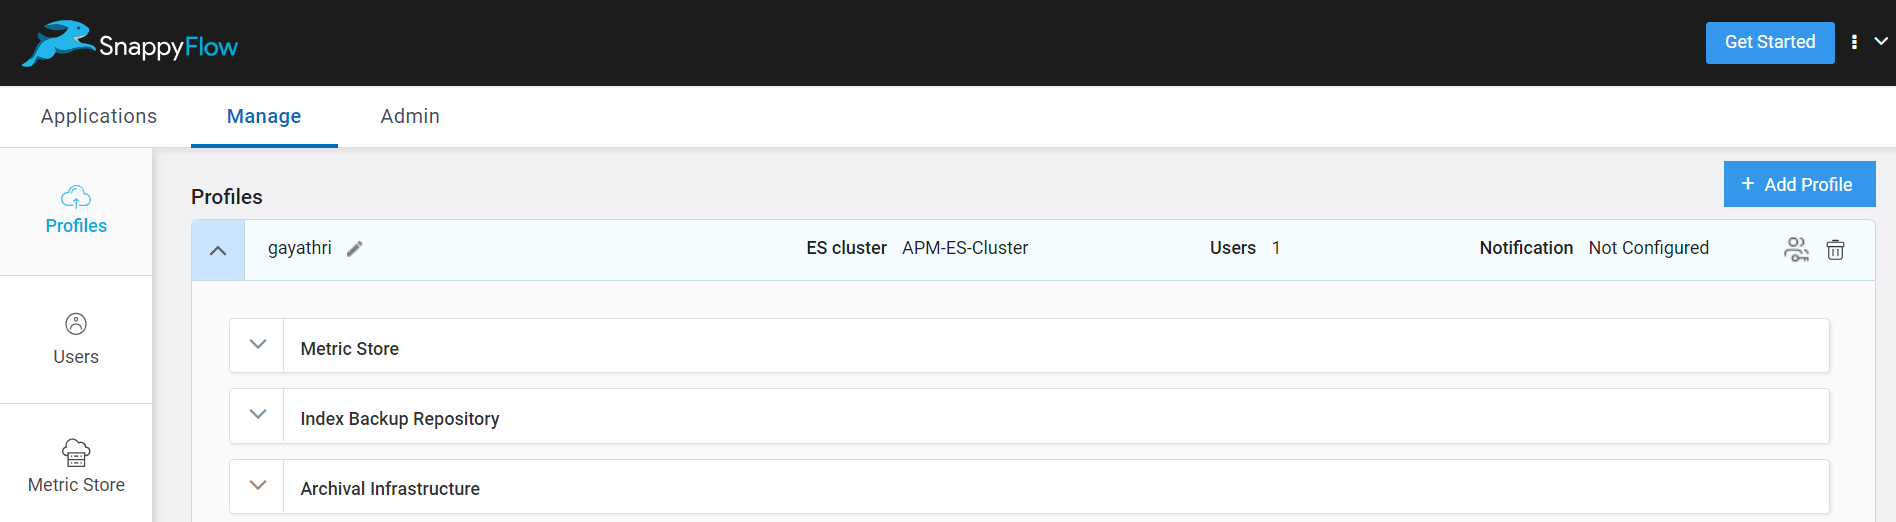
Navigate to Archival Infrastructure section.
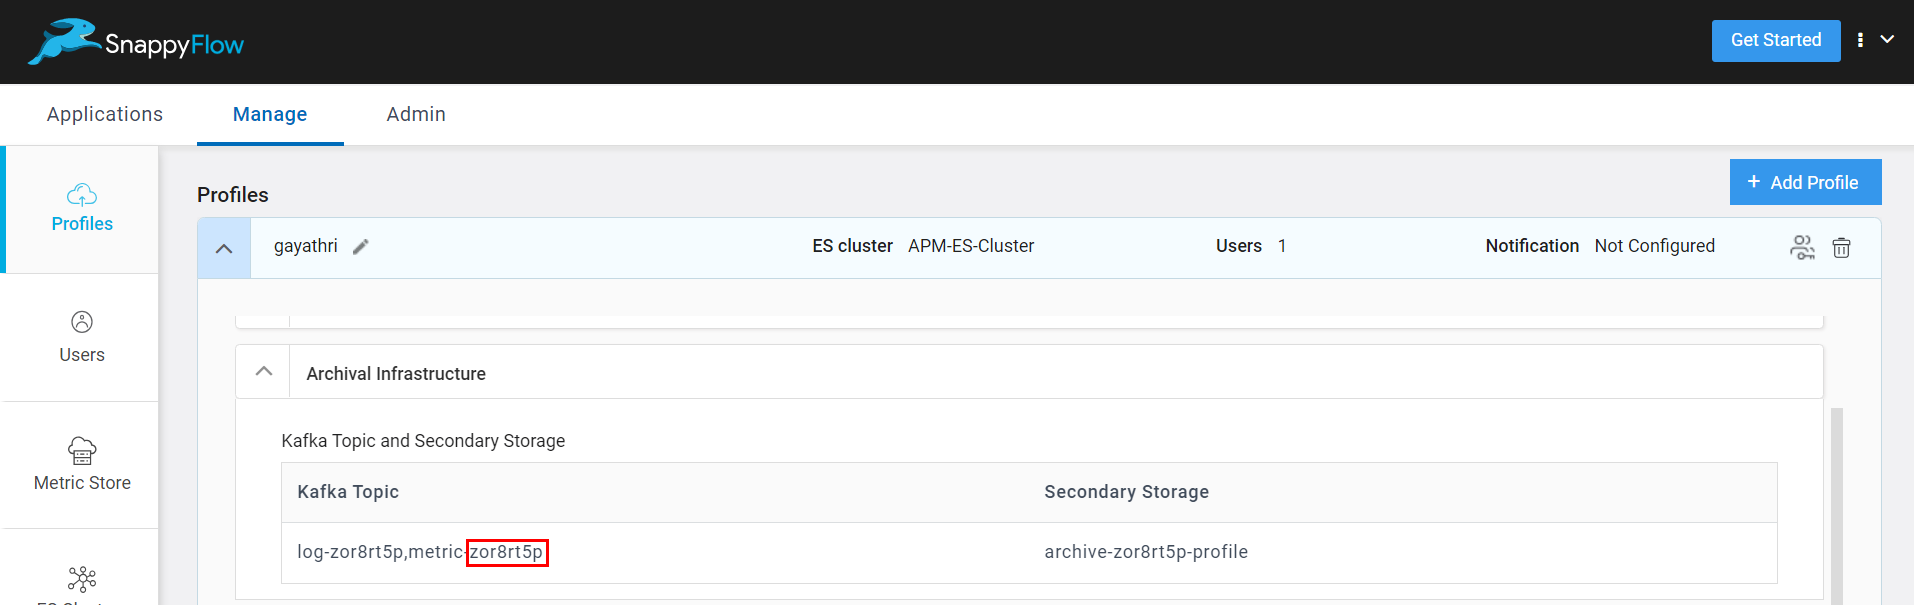
Under the Kafka Topic and Secondary Storage > Kafka Topic you can see the 8 digit Profile Id as shown in the above image.
Copy the Profile Id to clipboard and use the same during configuration.
Configuration
Add the following command in the
Gemfile.gem 'elastic-apm'Run the following command to install the dependencies.
bundle installAdd the following lines of code to the
application.rbfile located insideconfigfolder.require "elastic-apm"
config.elastic_apm.service_name = ENV['SERVICE_NAME']
config.elastic_apm.server_url = ENV['APM_SERVER_URL']
config.elastic_apm.global_labels = "_tag_projectName=#{ENV['PROJECT_NAME']},_tag_appName=#{ENV['APP_NAME']},_tag_profileId=#{ENV['PROFILE_ID']}"
config.elastic_apm.verify_server_cert= false
config.elastic_apm.central_config= falsenoteThe values mentioned in the above configuration will be passed through the environment variables from the docker file.
Add the below given Environment Variables to the docker file.
ENV SERVICE_NAME=<service-name>
ENV APM_SERVER_URL=<APM DNS>:443/sftrace
ENV PROJECT_NAME=<project-name>
ENV APP_NAME=<app-name>
ENV PROFILE_ID=<profile-id>
Rebuild the docker image.
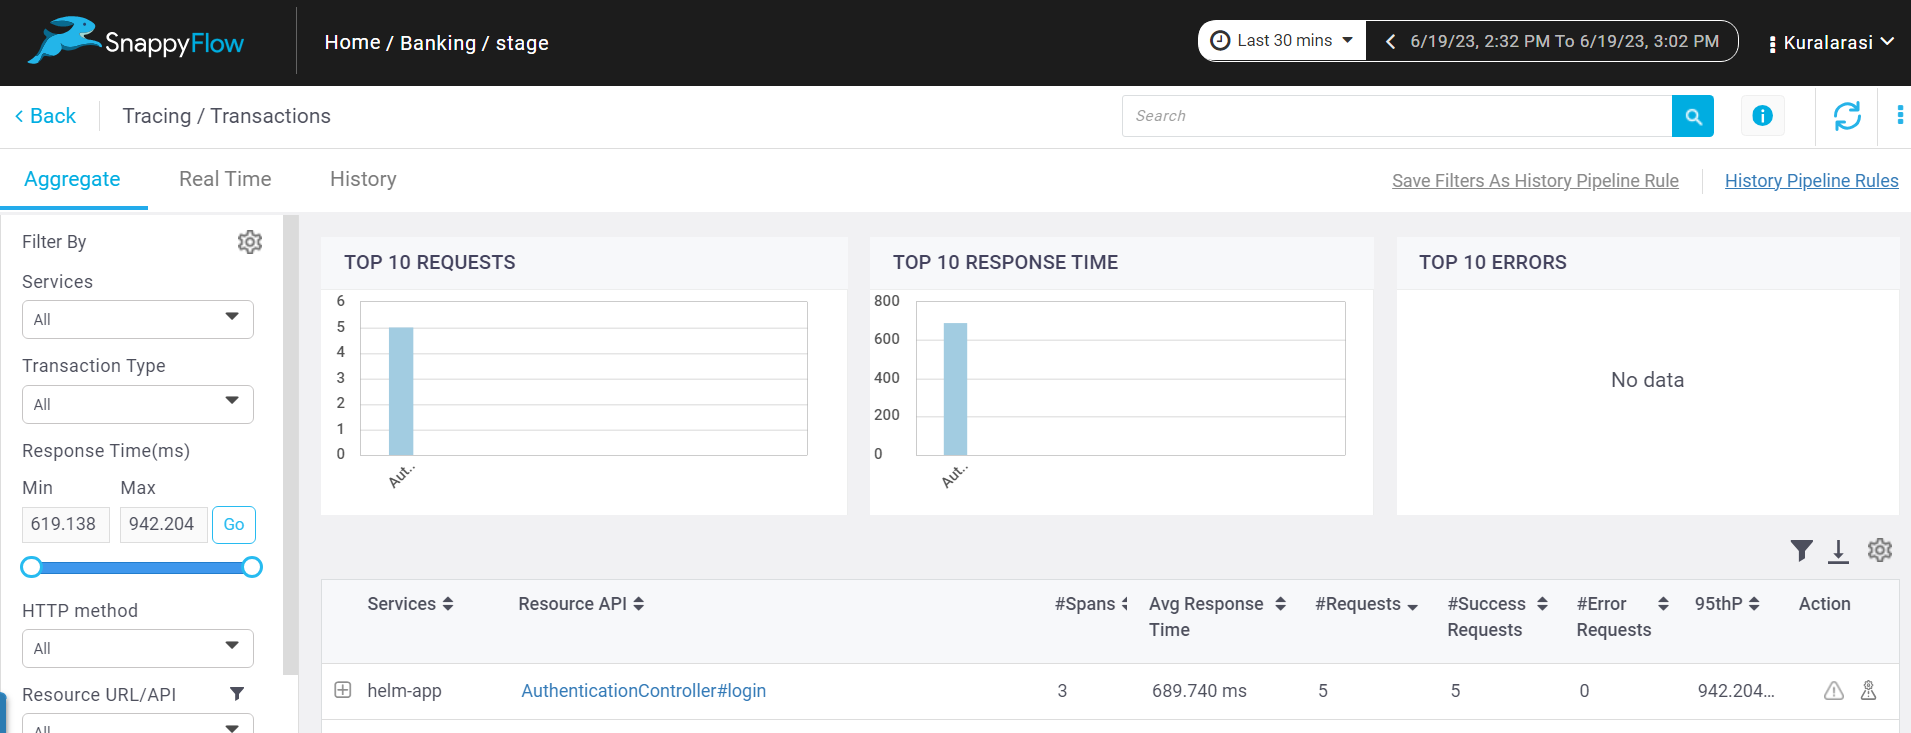
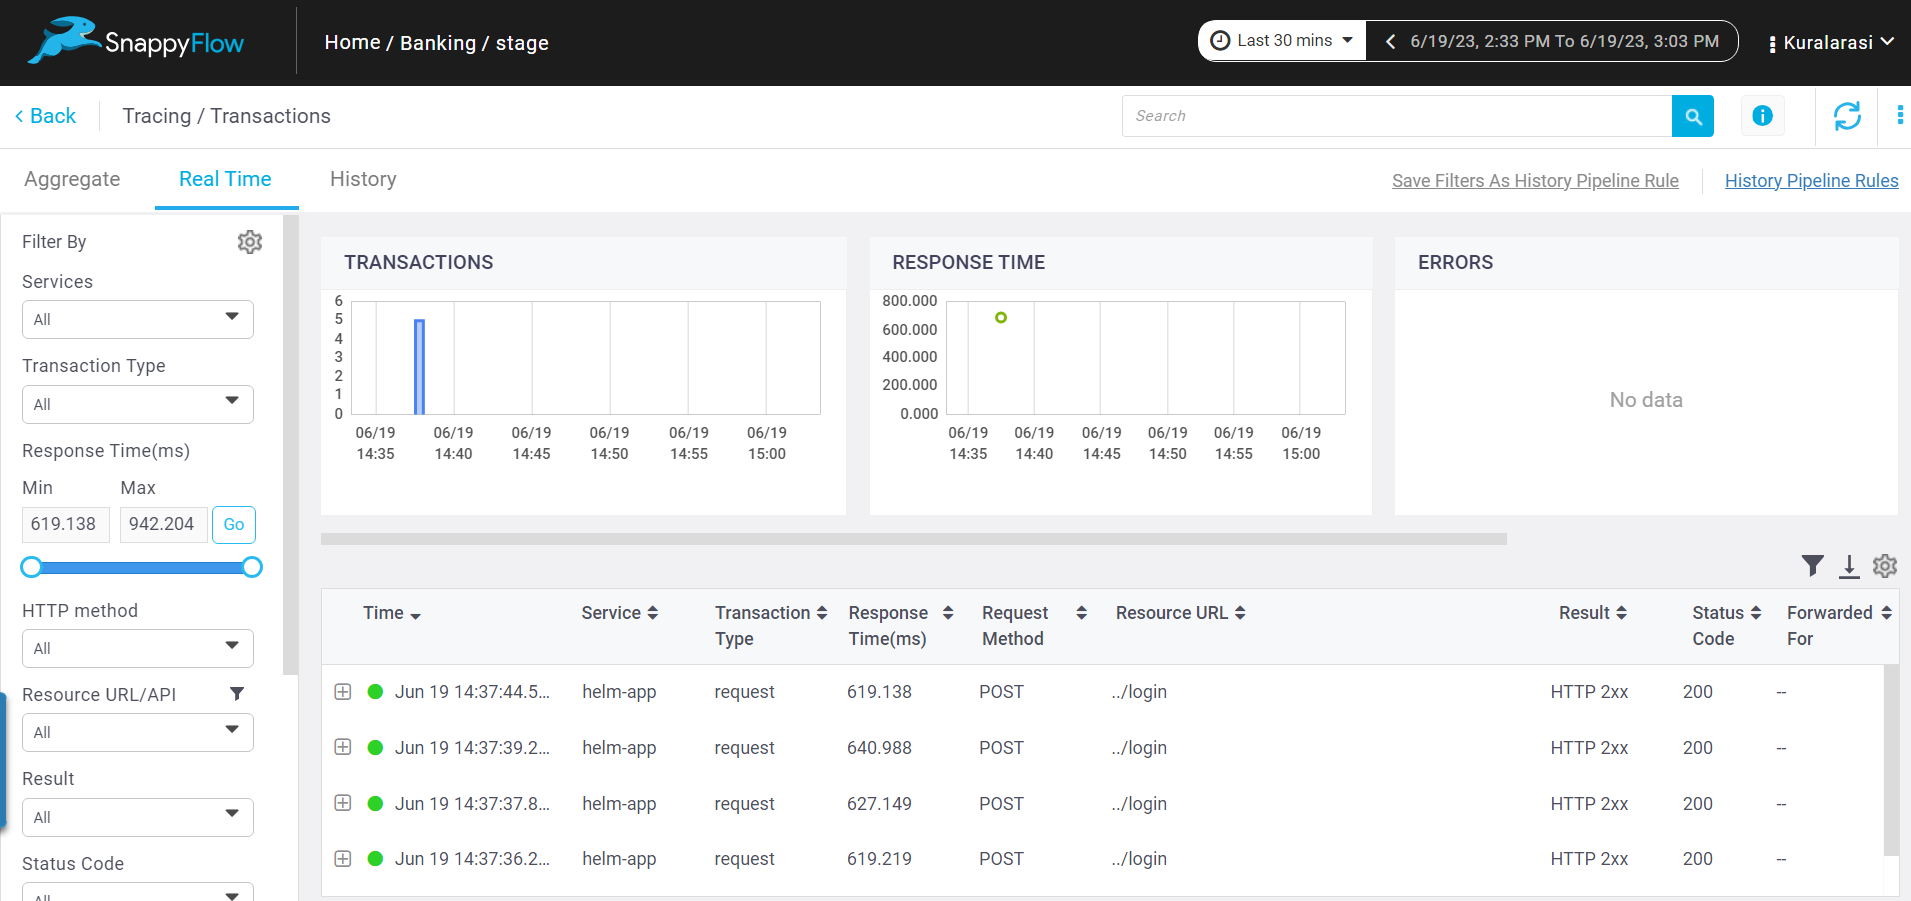
View Trace Data
Go to the Application tab in SnappyFlow and navigate to your Project > Application > Dashboard.
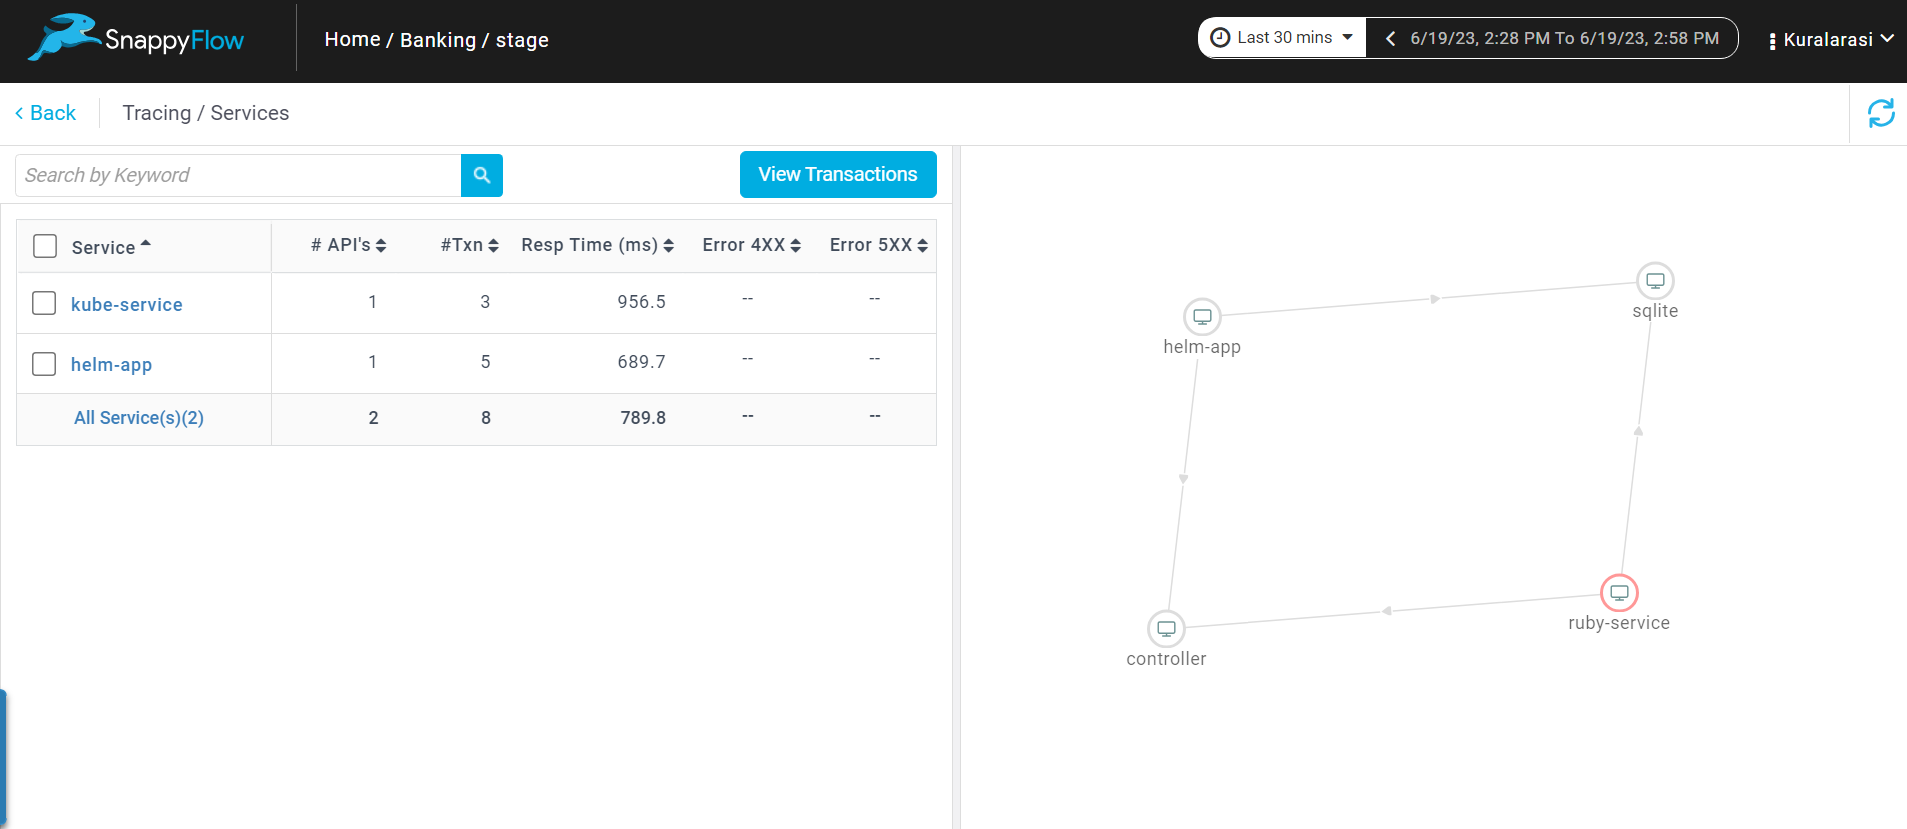
In the dashboard window, navigate to the Tracing section and click the
View Transactionsbutton.You can view the traces in the Aggregate and the Real Time tabs.