Python in ECS
Supported Frameworks
Standard Library Modules
Django
Prerequisite
To enable tracing for an application developed by Django framework sf-elastic-apm and sf-apm-lib must be available in your environment. These libraries can be installed by the following methods:
Add the below-mentioned entries in the requirements.txt file.
sf-elastic-apm==6.7.2
sf-apm-lib==0.1.5
OR
Install the libraries using CLI.
pip install sf-elastic-apm==6.7.2
pip install sf-apm-lib==0.1.5
Configuration
Make sure the project and application is created in the SnappyFlow Server. Click here to know how to create the project and application in SnappyFlow.
Add the following entries in the settings.py file.
Add the following import statements.
from sf_apm_lib.snappyflow import Snappyflow
import os
Add the following entry in the
INSTALLED_APPSblock.'elasticapm.contrib.django'Add the following entry in the
MIDDLEWAREblock.'elasticapm.contrib.django.middleware.TracingMiddleware'Add the following source code to integrate a Django application with the SnappyFlow.
try:
  sf = Snappyflow()
  # Add below part to manually configure the initialization
  SF_PROJECT_NAME = os.getenv('SF_PROJECT_NAME')
  SF_APP_NAME = os.getenv('SF_APP_NAME')
  SF_PROFILE_KEY = os.getenv('SF_PROFILE_KEY')
  sf.init(SF_PROFILE_KEY, SF_PROJECT_NAME, SF_APP_NAME)
  # End of manual configuration

  SFTRACE_CONFIG = sf.get_trace_config()

  ELASTIC_APM={
    # Specify your service name for tracing
  'SERVICE_NAME': "custom-service" ,
  'SERVER_URL': SFTRACE_CONFIG.get('SFTRACE_SERVER_URL'),
  'GLOBAL_LABELS': SFTRACE_CONFIG.get('SFTRACE_GLOBAL_LABELS'),
  'VERIFY_SERVER_CERT': SFTRACE_CONFIG.get('SFTRACE_VERIFY_SERVER_CERT'),
  'SPAN_FRAMES_MIN_DURATION': SFTRACE_CONFIG.get('SFTRACE_SPAN_FRAMES_MIN_DURATION'),
  'STACK_TRACE_LIMIT': SFTRACE_CONFIG.get('SFTRACE_STACK_TRACE_LIMIT'),
  'CAPTURE_SPAN_STACK_TRACES': SFTRACE_CONFIG.get('SFTRACE_CAPTURE_SPAN_STACK_TRACES'),
  'DJANGO_TRANSACTION_NAME_FROM_ROUTE': True,
  'CENTRAL_CONFIG': False,
  'METRICS_INTERVAL': '0s'
  }
  except Exception as error:
  print("Error while fetching snappyflow tracing configurations", error)
Provide
SF_PROJECT_NAME,SF_APP_NAME,SF_PROFILE_KEYas environment variables in theadd containersection of task definitions.
Refer the below documentation: https://catalog.us-east-1.prod.workshops.aws/workshops/c6bdf8dc-d2b2-4dbd-b673-90836e954745/en-US/container-migration/create-task-definition
If your app is in debug mode (eg: settings.Debug = true), then the agent won’t send any tracing data to the SnappyFlow server. You can override it by adding 'Debug':True configuration in the ELASTIC_APM block.
Verification
Follow the below steps to verify and view the trace data.
Login into SnappyFlow.
Go to the Application tab.
In the Application tab, navigate to your Project > Application.
Click the Application's Dashboard icon.
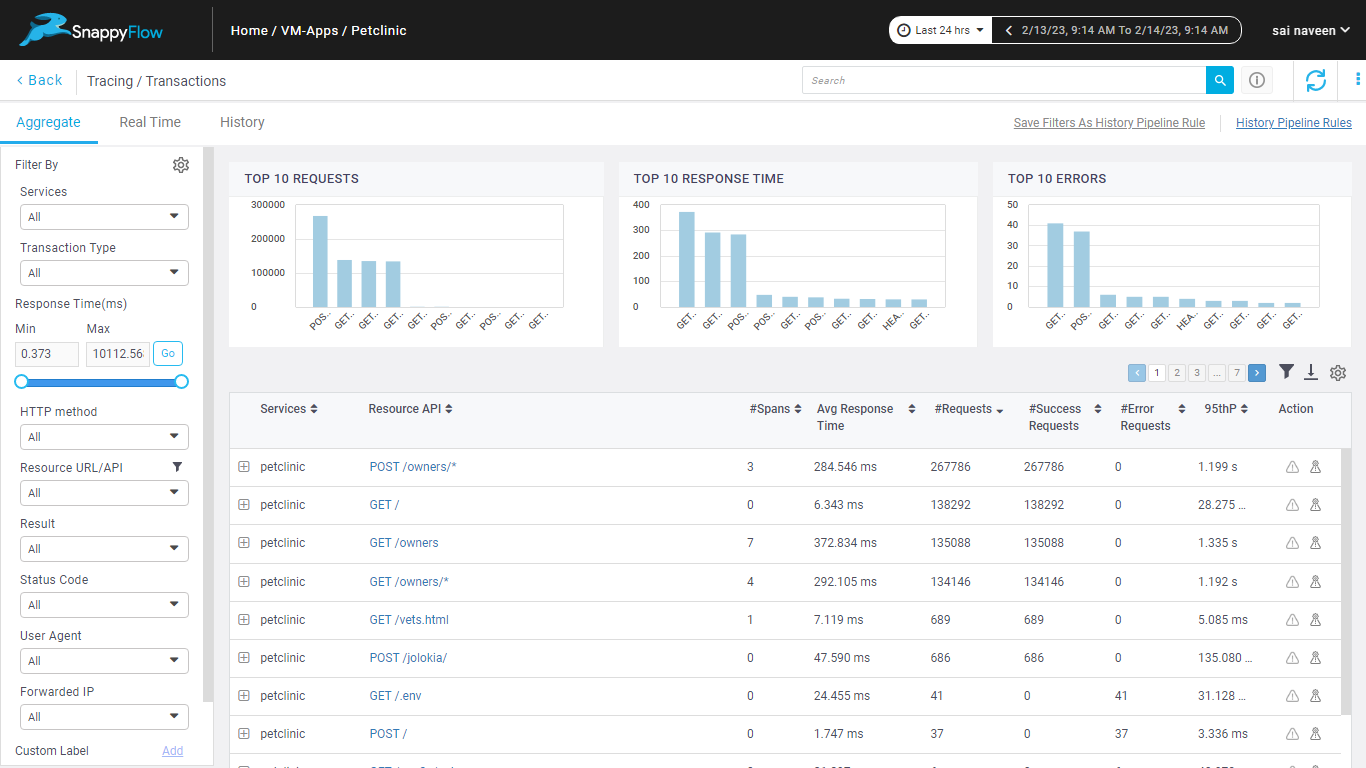
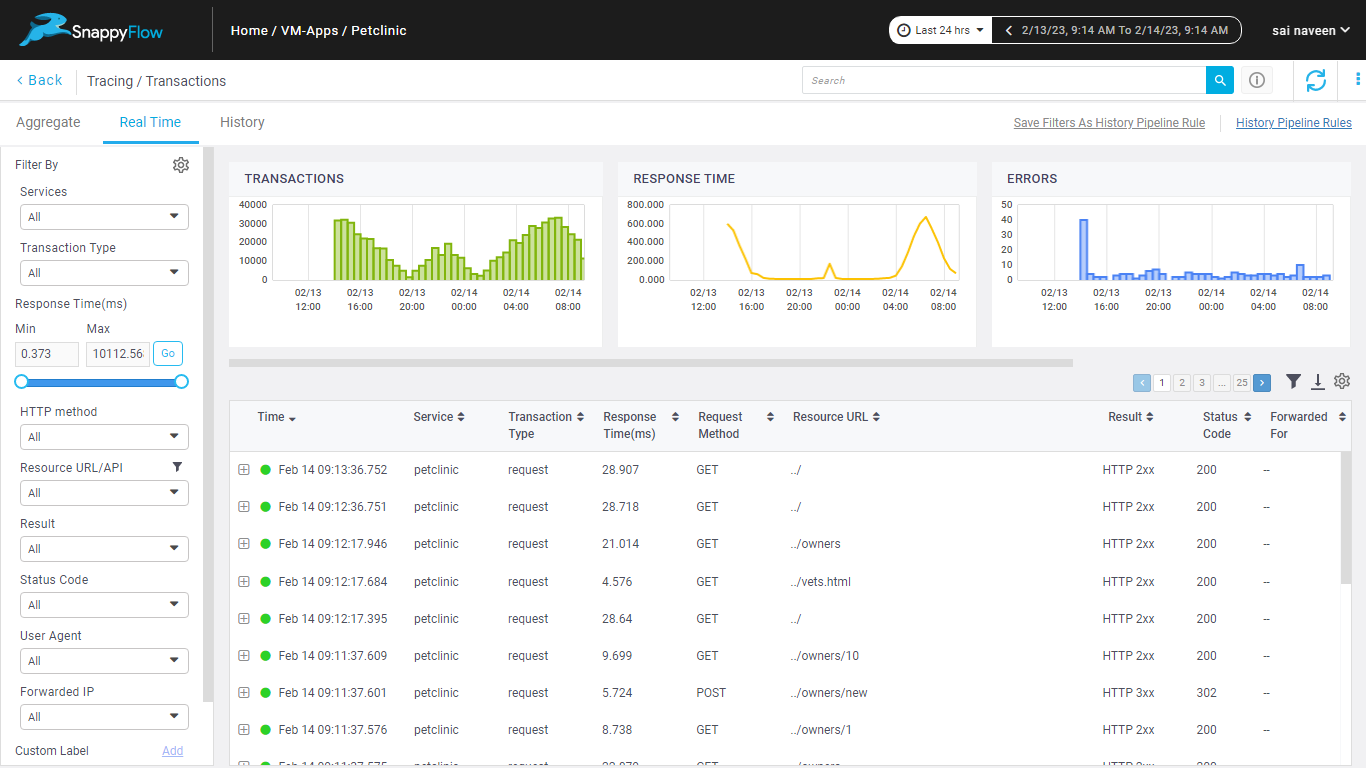
Navigate to the Tracing section and click the
View Transactionsbutton.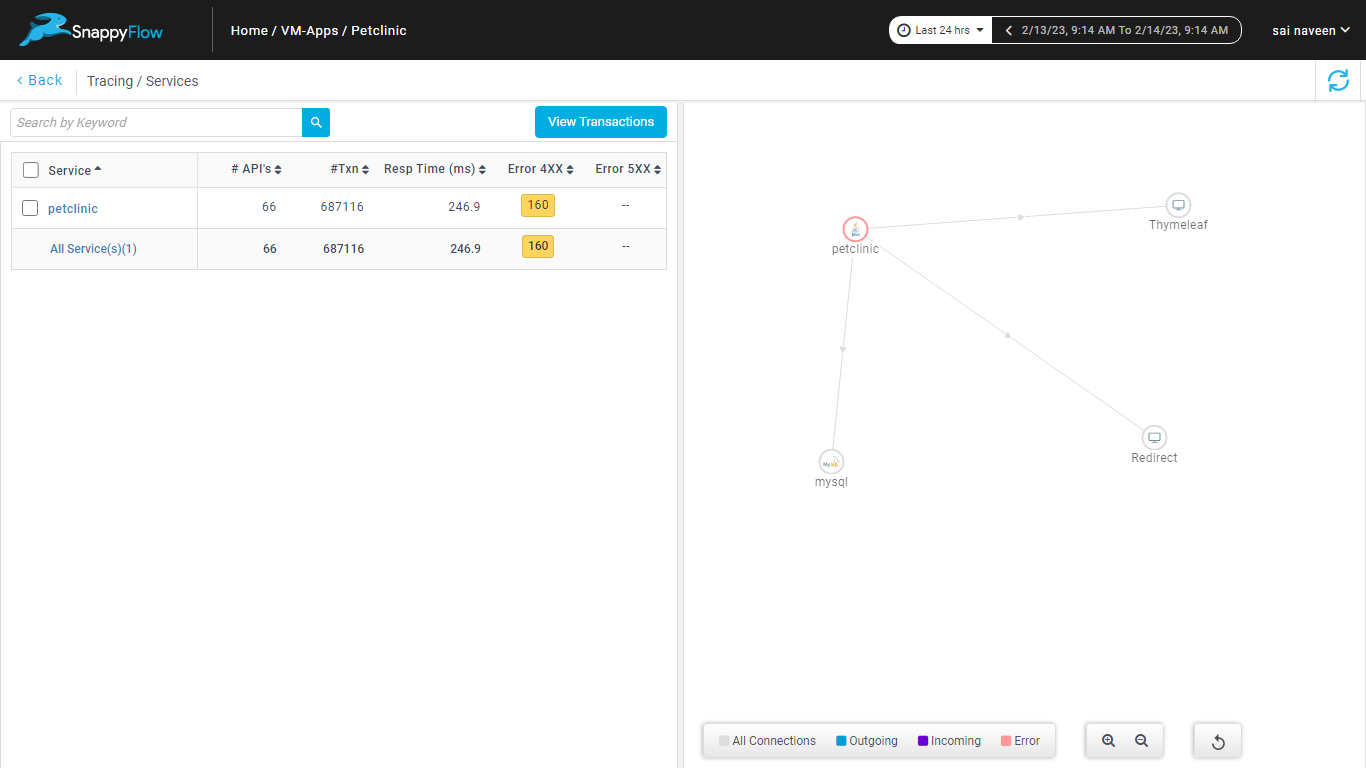
You can view the traces in the Aggregate and the Real Time tabs.
Troubleshoot
If the trace data is unavailable in the SnappyFlow server, check the trace configuration in the
settings.py.Add the key-value pair in the
ELASTIC_APMblock of thesettings.pyfile to enable the debug logs.'DEBUG':True
Sample Application Code
Click here to view the sample application for which the configuration mentioned in the above sections enables the tracing feature.
Flask
Prerequisite
To enable tracing for an application developed by Flask framework sf-elastic-apm and sf-apm-lib must be available in your environment. These libraries can be installed by the following methods:
Add the below-mentioned entries in the requirements.txt file.
sf-elastic-apm[flask]==6.7.2
sf-apm-lib==0.1.5
OR
Install the libraries using CLI.
pip install sf-elastic-apm[flask]==6.7.2
pip install sf-apm-lib==0.1.5
Configuration
Make sure the project and application are created in the SnappyFlow Server. Click here to know how to create a project and an application in SnappyFlow.
Add the following entries in the app.py file.
Add the following import statements.
from elasticapm.contrib.flask import ElasticAPM
from sf_apm_lib.snappyflow import Snappyflow
import os
Add the following source code to integrate a Flask application with SnappyFlow.
sf = Snappyflow()
    # Add below part to manually configure the initialization
    SF_PROJECT_NAME = os.getenv('SF_PROJECT_NAME')
    SF_APP_NAME = os.getenv('SF_APP_NAME')
    SF_PROFILE_KEY = os.getenv('SF_PROFILE_KEY')
    sf.init(SF_PROFILE_KEY, SF_PROJECT_NAME, SF_APP_NAME)
    # End of manual configuration
    SFTRACE_CONFIG = sf.get_trace_config()
    app.config['ELASTIC_APM'] = {
        # Specify your service name for tracing
       'SERVICE_NAME': 'flask-service',
       'SERVER_URL': SFTRACE_CONFIG.get('SFTRACE_SERVER_URL'),
       'GLOBAL_LABELS': SFTRACE_CONFIG.get('SFTRACE_GLOBAL_LABELS'),
       'VERIFY_SERVER_CERT': SFTRACE_CONFIG.get('SFTRACE_VERIFY_SERVER_CERT'),
       'SPAN_FRAMES_MIN_DURATION': SFTRACE_CONFIG.get('SFTRACE_SPAN_FRAMES_MIN_DURATION'),
       'STACK_TRACE_LIMIT': SFTRACE_CONFIG.get('SFTRACE_STACK_TRACE_LIMIT'),
       'CAPTURE_SPAN_STACK_TRACES': SFTRACE_CONFIG.get('SFTRACE_CAPTURE_SPAN_STACK_TRACES'),
       'METRICS_INTERVAL': '0s'
     }
     apm = ElasticAPM(app)
- Provide
SF_PROJECT_NAME,SF_APP_NAME,SF_PROFILE_KEYas environment variables in theadd containersection of task definitions.
Refer to the below documentation: https://catalog.us-east-1.prod.workshops.aws/workshops/c6bdf8dc-d2b2-4dbd-b673-90836e954745/en-US/container-migration/create-task-definition
If your app is in debug mode (eg: app.Debug = true), then the agent won’t send any tracing data to the SnappyFlow server. You can override it by adding 'Debug':True configuration in the ELASTIC_APM block.
Verification
Follow the below steps to verify and view the trace data.
Login into SnappyFlow.
Go to the Application tab.
In the Application tab, navigate to your Project > Application.
Click the Application's Dashboard icon.
Navigate to the Tracing section and click the
View Transactionsbutton.You can view the traces in the Aggregate and the Real Time tabs.
Troubleshoot
If the trace data is unavailable in the SnappyFlow server, check the trace configuration in the
app.py.Add the key-value pair in the
app.configblock of theapp.pyfile to enable the debug logs.'DEBUG':True
Sample Application Code
Click here to view the sample application for which the configuration mentioned in the above sections enables the tracing feature.
Celery
The Celery configuration explained below is based on redis broker.
Prerequisite
To enable tracing for an application developed by Celery, sf-elastic-apm, redis and sf-apm-lib must be available in your environment.
Install the following requirements.
pip install sf-elastic-apm==6.7.2
pip install redis
pip install sf-apm-lib==0.1.5
Configuration
To setup elastic apm client, add the following code at the start of the file where Celery app is initialized.
from sf_apm_lib.snappyflow import Snappyflow
from elasticapm import Client, instrument
from elasticapm.contrib.celery import register_exception_tracking, register_instrumentation

instrument()

try:
 sf = Snappyflow() # Initialize Snappyflow. By default intialization will take profileKey, projectName and appName from sfagent config.yaml

 # Add below part to manually configure the initialization

 SF_PROJECT_NAME = '<SF_PROJECT_NAME>' # Replace with appropriate Snappyflow project name
 SF_APP_NAME = '<SF_APP_NAME>' # Replace with appropriate Snappyflow app name
 SF_PROFILE_KEY = '<SF_PROFILE_KEY>' # Replace Snappyflow Profile key
 sf.init(SF_PROFILE_KEY, SF_PROJECT_NAME, SF_APP_NAME)
 # End of manual configuration

 SFTRACE_CONFIG = sf.get_trace_config()
 apm_client = Client(
     service_name= '<Service_Name>', # Specify service name for tracing
     server_url= SFTRACE_CONFIG.get('SFTRACE_SERVER_URL'),
     global_labels= SFTRACE_CONFIG.get('SFTRACE_GLOBAL_LABELS'),
     verify_server_cert= SFTRACE_CONFIG.get('SFTRACE_VERIFY_SERVER_CERT')
     )

 register_exception_tracking(apm_client)
 register_instrumentation(apm_client)
 except Exception as error:
 print("Error while fetching snappyflow tracing configurations", error)
Verification
Once the instrumentation is done and the Celery worker is running, you can see a trace for each celery task in the Snappyflow server. Follow the below steps to verify and view the traces.
Login into SnappyFlow.
Go to the Application tab.
In the Application tab, navigate to your Project > Application.
Click the Application's Dashboard icon.
Navigate to the Tracing section and click the
View Transactionsbutton.You can view the traces in the Aggregate and the Real Time tabs.
Reference Code
Refer complete code: https://github.com/snappyflow/tracing-reference-apps/blob/master/ref-celery/tasks.py