RUM Dashboard
The Real User Monitoring Tab is available under the application dashboard just below the Tracing Tab. The various views of the data captured by the sf-apm-rum agent can be viewed under this tab. There are 3 panes that help us provide different views of the captured data.
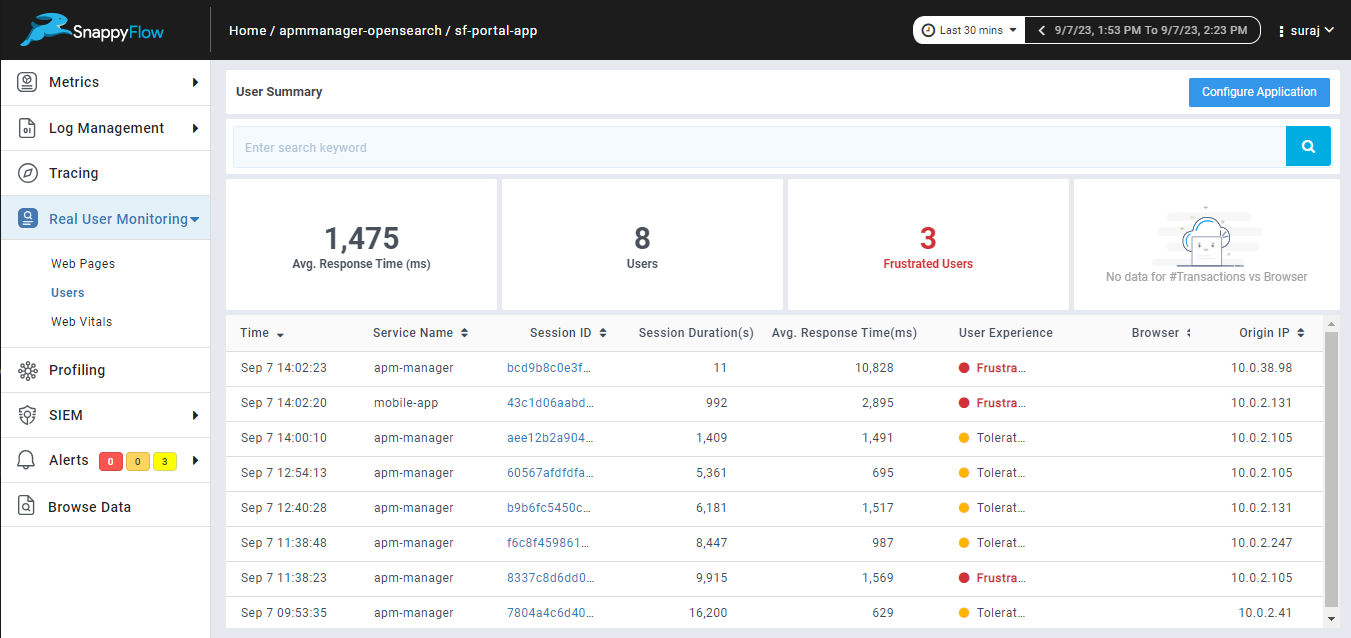
Web Pages Pane
This pane provides the overview of the data captured. This view is helpful in understanding the statistics of the usage of the application. It helps the user to know the User Experience, Count of the pages used, Average Response time, Number of Transactions occured which helps the user to understand the current usage of the application. It helps the user to get the information about which type of event is predominant and the most used browser etc. The User Experience helps the user understand the user satisifaction for a target response time of 500 ms. Below is the snip of the Web pages pane for a typical application.
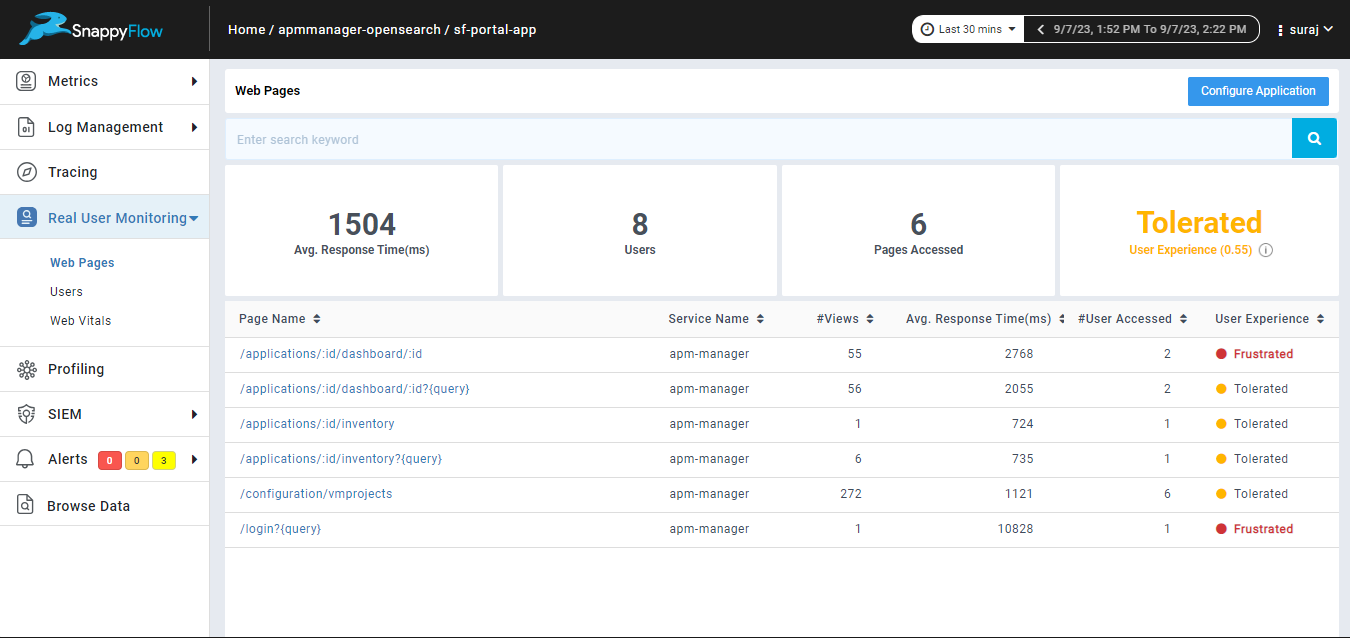
Users Pane
This pane provides the page wise statistics of the application. It provides the information such as top 10 slow pages, transaction wise and error wise breakup for each page. It also provides Average Response time, Number of transactions for each of the pages. This information helps the user to know about the performance, errors and usage of the pages using which the performance of the pages can be improved and the errors can be fixed. Below is the snip of the Pages pane for a typical application.
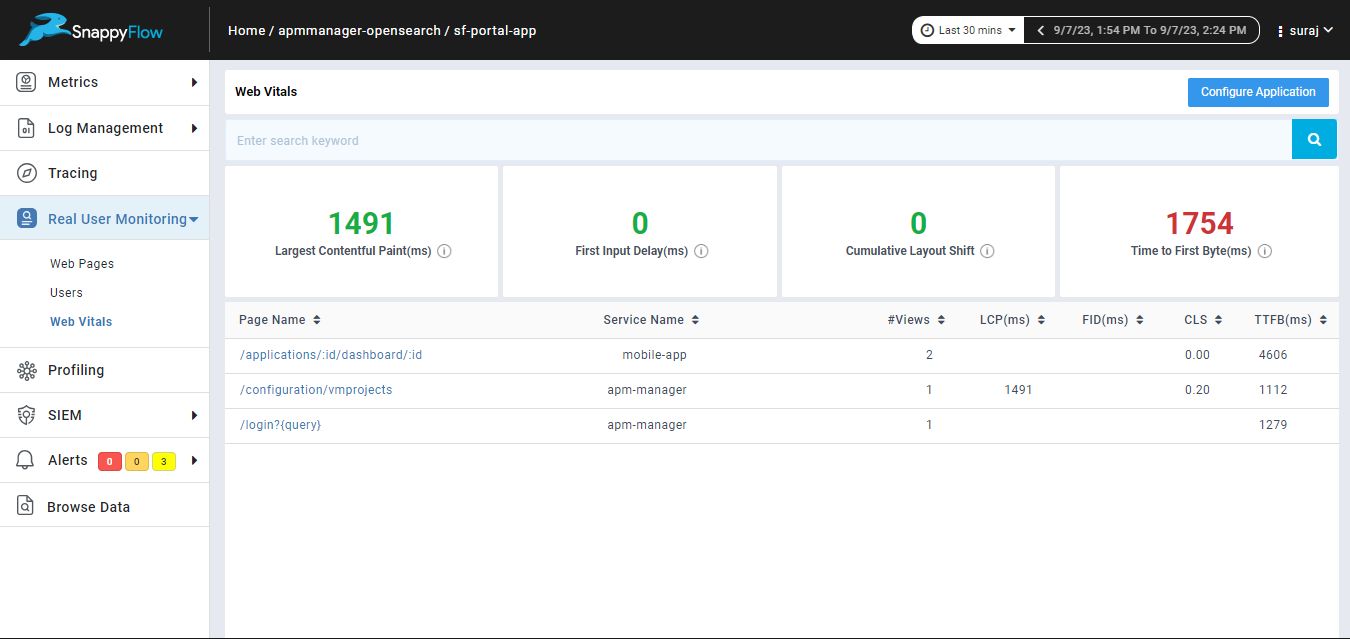
Web Vitals Pane
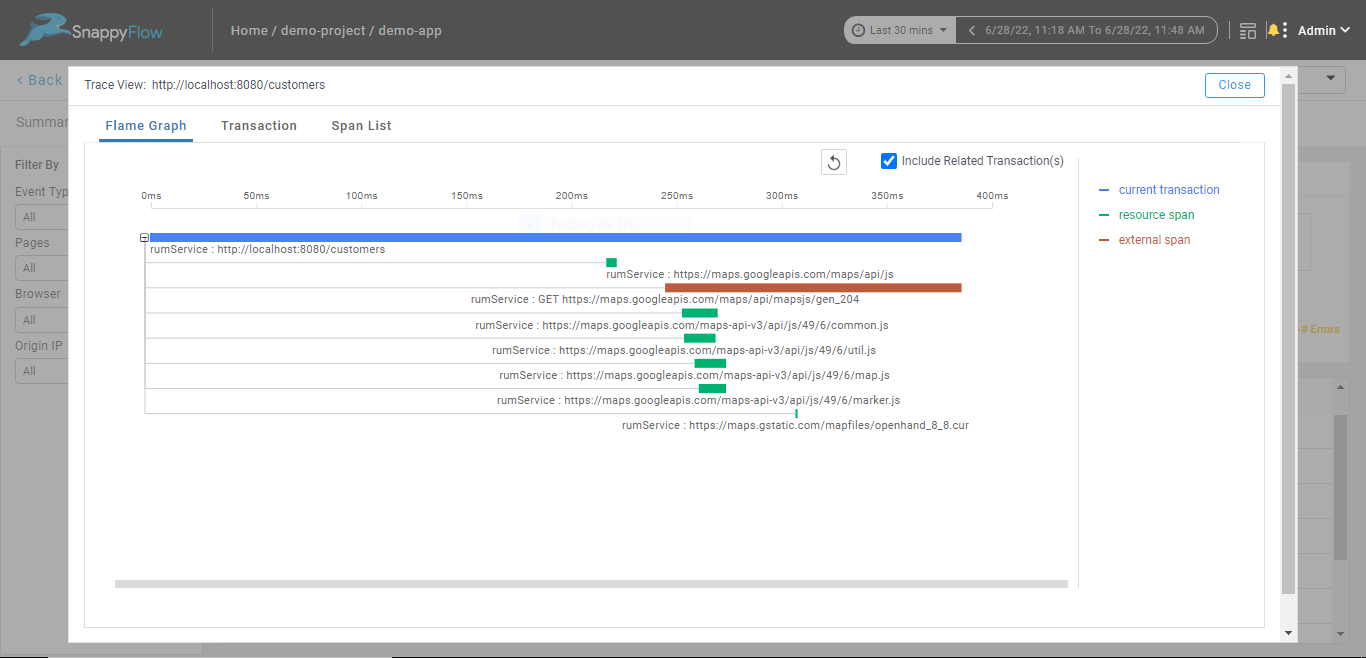
The RUM agent tries to capture the overall user experience on how the page is loaded/rendered as part of the page load Transaction. It includes all of the dependent resources, like JavaScript, stylesheets, images, etc., which are included as part of the page.