CPU Profiling
Pre-requisites
- Install Java - JDK 11
- Install sfAgent on Linux
note
- Add profile key and SnappyFlow tags in the config.yaml.
- For existing customers, update SFAgent config.yaml with latest - profile key, if SFAgent is already deployed.
- Reference for installing sfAgent : Click here
- Name and AppName should always be unique (pair).
- jcmd equivalent : Application Dashboard >> Process Name
CPU Profiling
- CPU profiling provides the thread wise CPU usage.
- Profiling helps us to identify various issues :
- Synchronization Issues :
- Deadlock Situation : when several threads running hold a synchronized block on a shared object
- Thread Contention : when a thread is blocked waiting for others to finish
- Execution Issues :
- Abnormally high CPU usage : when a thread is in running state for a very long period of time
- Processing Performance is low : when many threads are blocked
- Synchronization Issues :
- It also provides an ability to correlate the thread stack at that time.
- Java CPU profiling can be collected by using Java profiling plugin.
config.yaml
metrics:
  plugins:
    - name: javaprofiling
      enabled: true
      interval: 10
      target: profile
      config:
        process: process_name      # otherwise mention '*'
        monitorCpuProfiling: true
        cpuProfilingInterval: 10
        stackTraceLimit: 25
CPU profiling interval :
- It is by default set to 10 seconds.
- It is recommended to keep it 10s to get better overview to the thread.
- Increasing this we might miss out frequent thread state changes.
Stack trace limit :
- It is set to 25 by default.
- If need this can be increased or decreased.
CPU Profiling tool :
- It itself will consume some amount of CPU.
- The feature can be turned off after fixing your issue using the flag monitorCpuProfiling.
Process :
- It provides the process name for which CPU profiling needs to be enabled. Regex can also be used.
CPU Profiling Dashboards :
To view the CPU profiling dashboards :
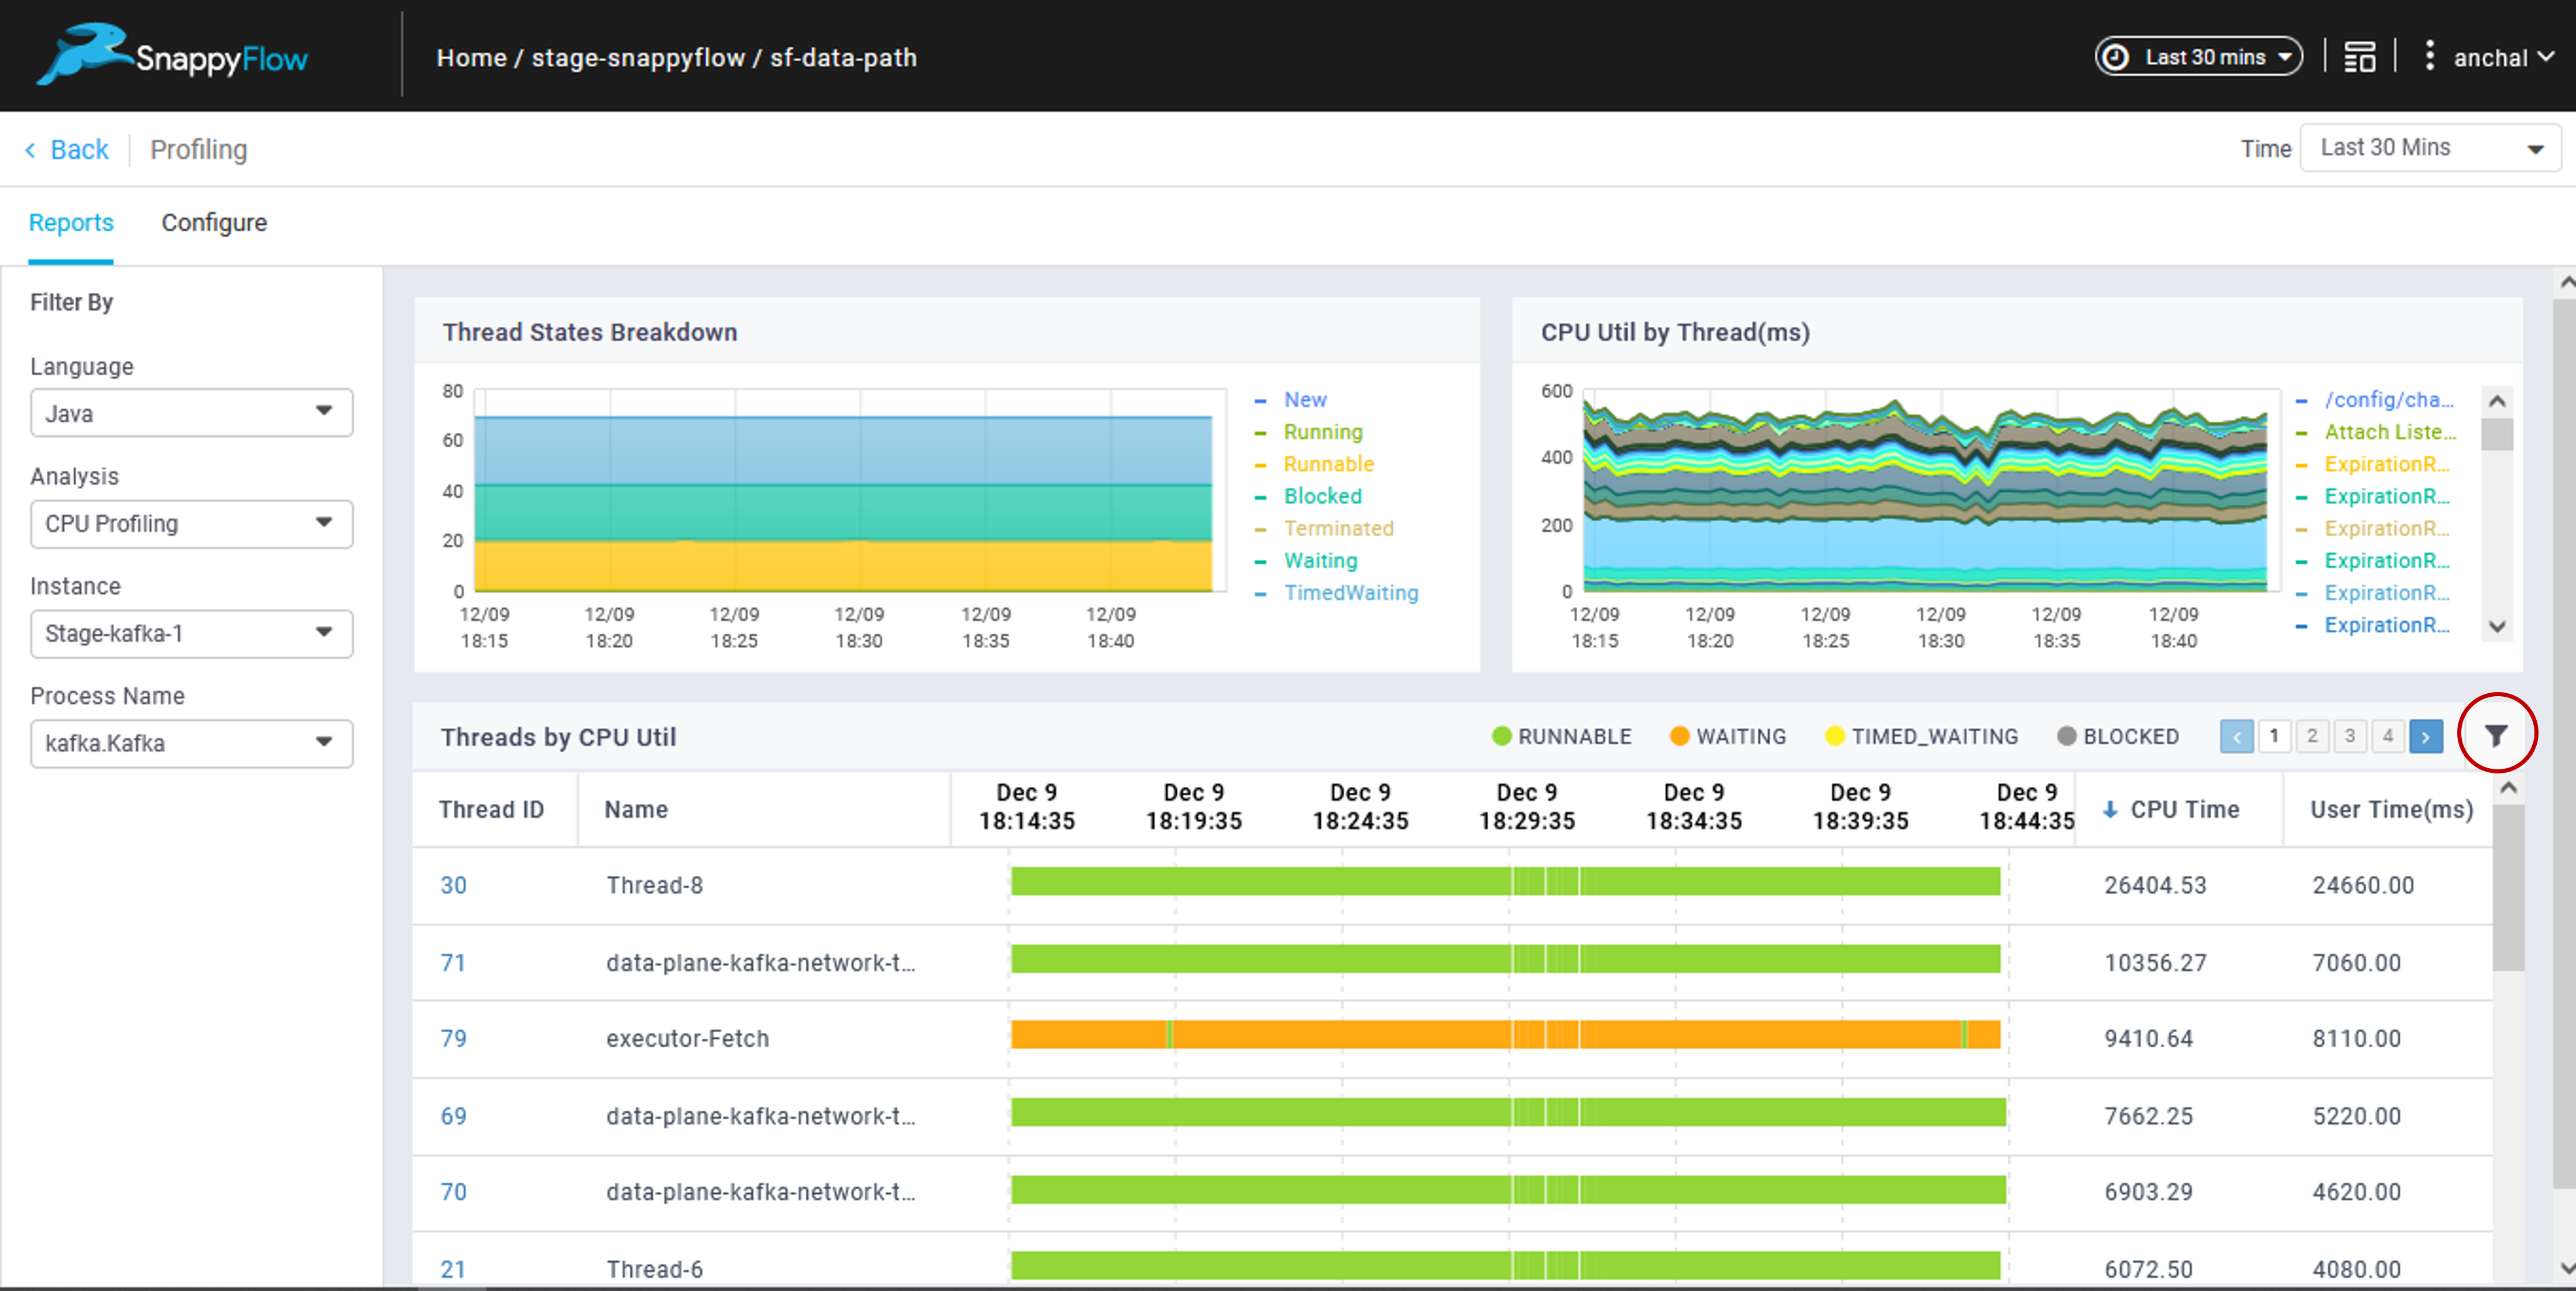
- Dashboards >> Profiling pane >> Select Java in the language dropdown next
- CPU Profiling from the dropdown >> Select the instance, process name from the next dropdowns.
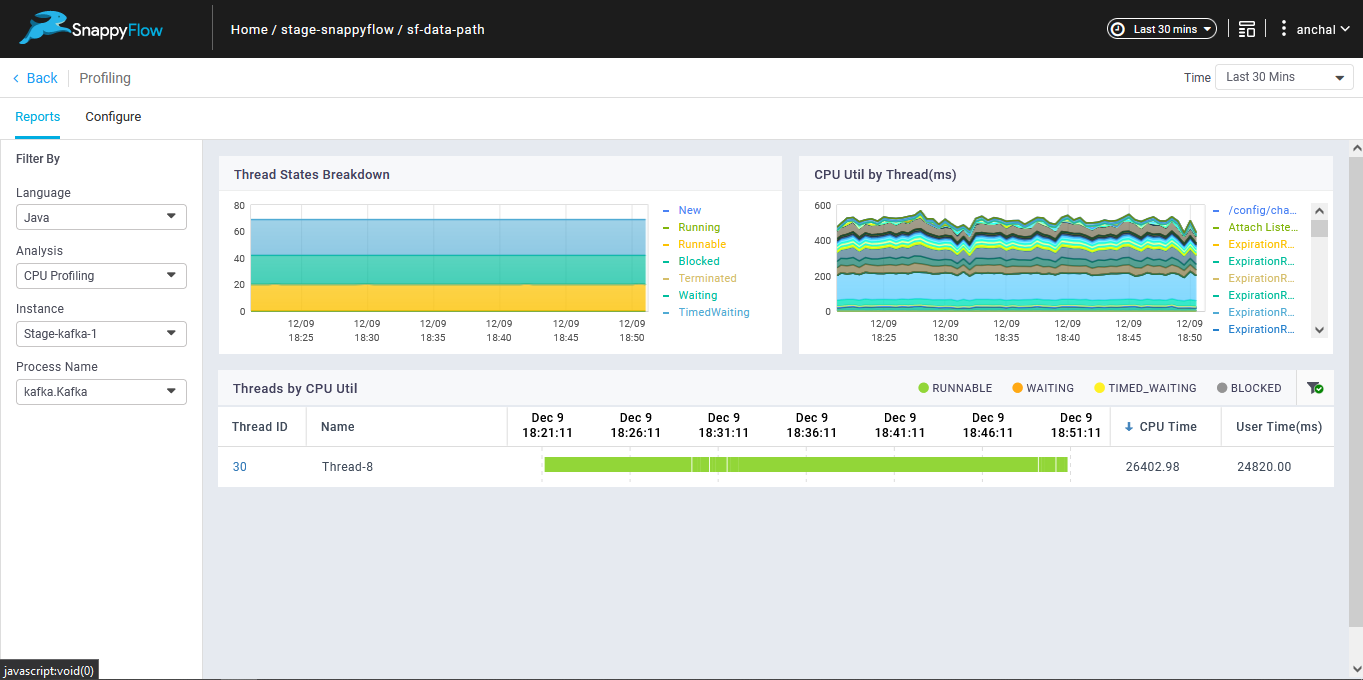
- It displays the thread activity in the form of visuals.
- We can easily find blocked threads and reasons why they are blocked.
Screenshots
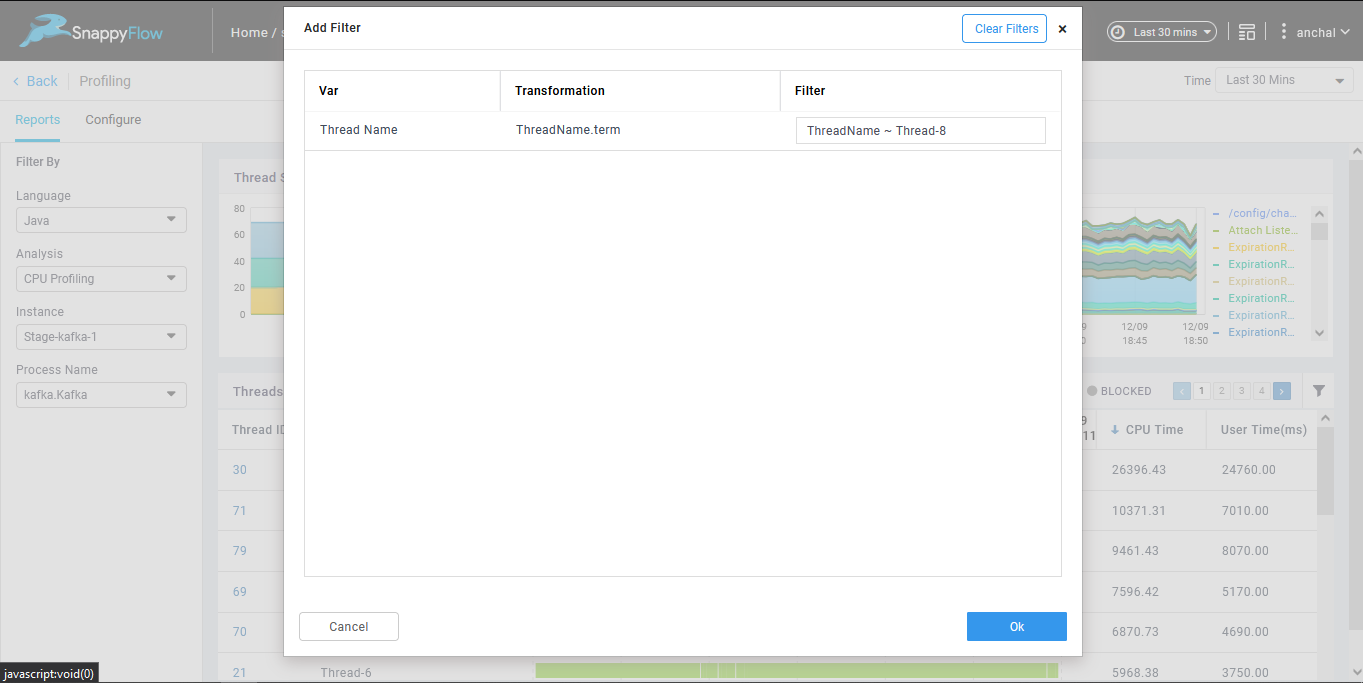
Click on the filter icon to add filters.
To add filters, write the thread name by prepending ~ in the Filter column : e.g. ThreadName ~ Thread-8 and then click on OK.
Click the thread from the list.
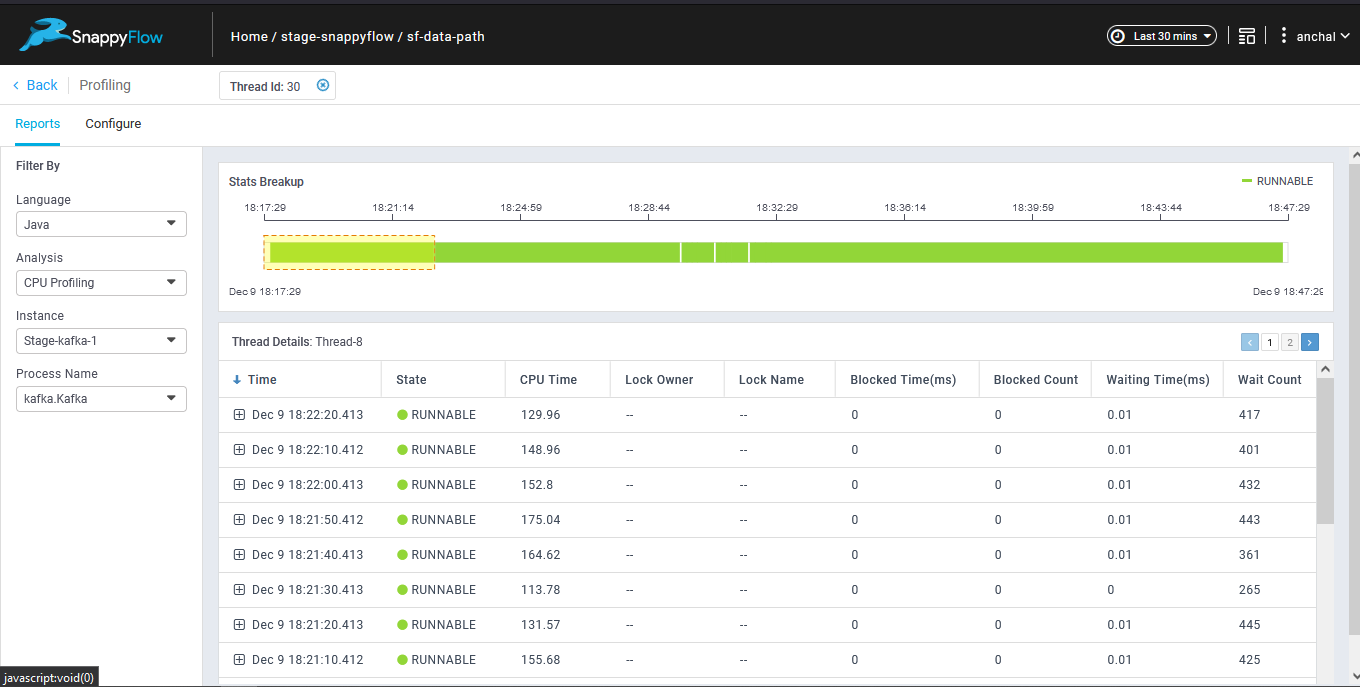
You can modify the start and end time of the thread in the Stats Breakup.
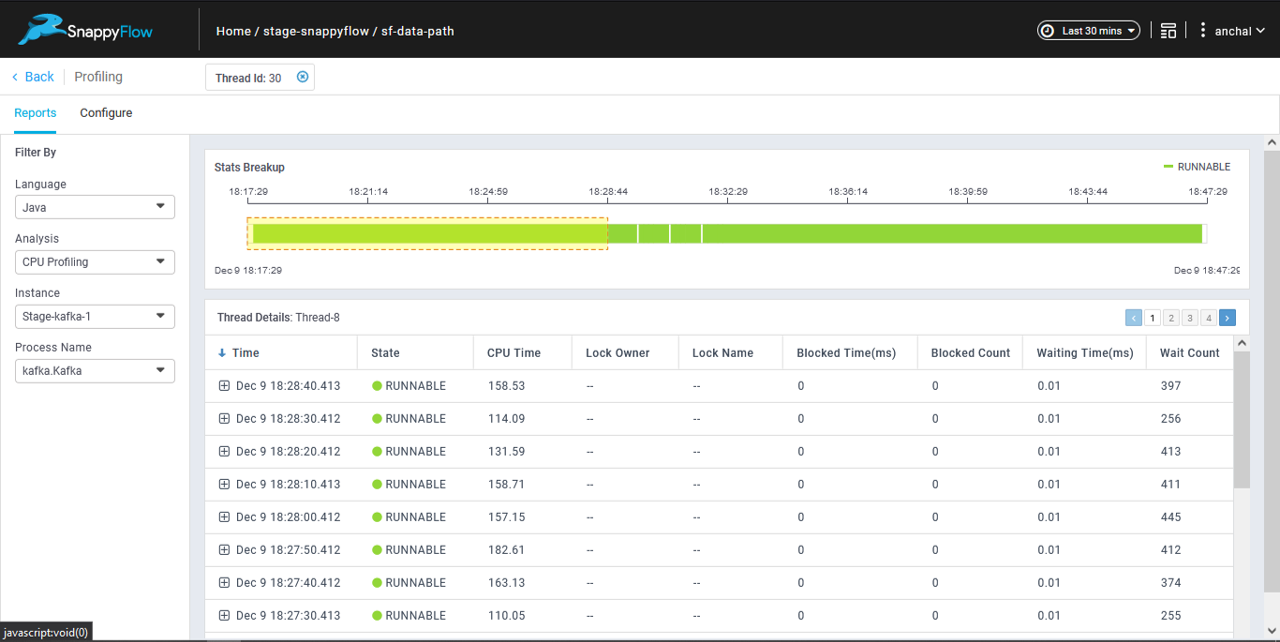
You can expand the list item to get more information.
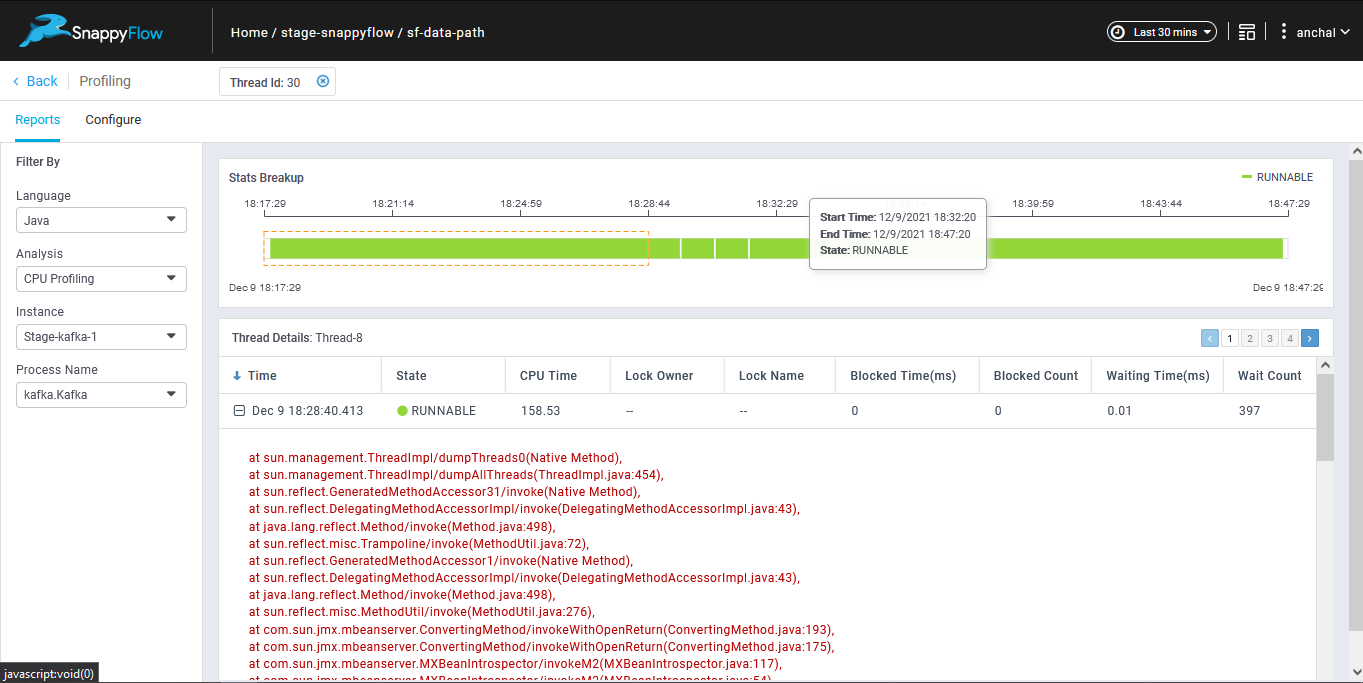
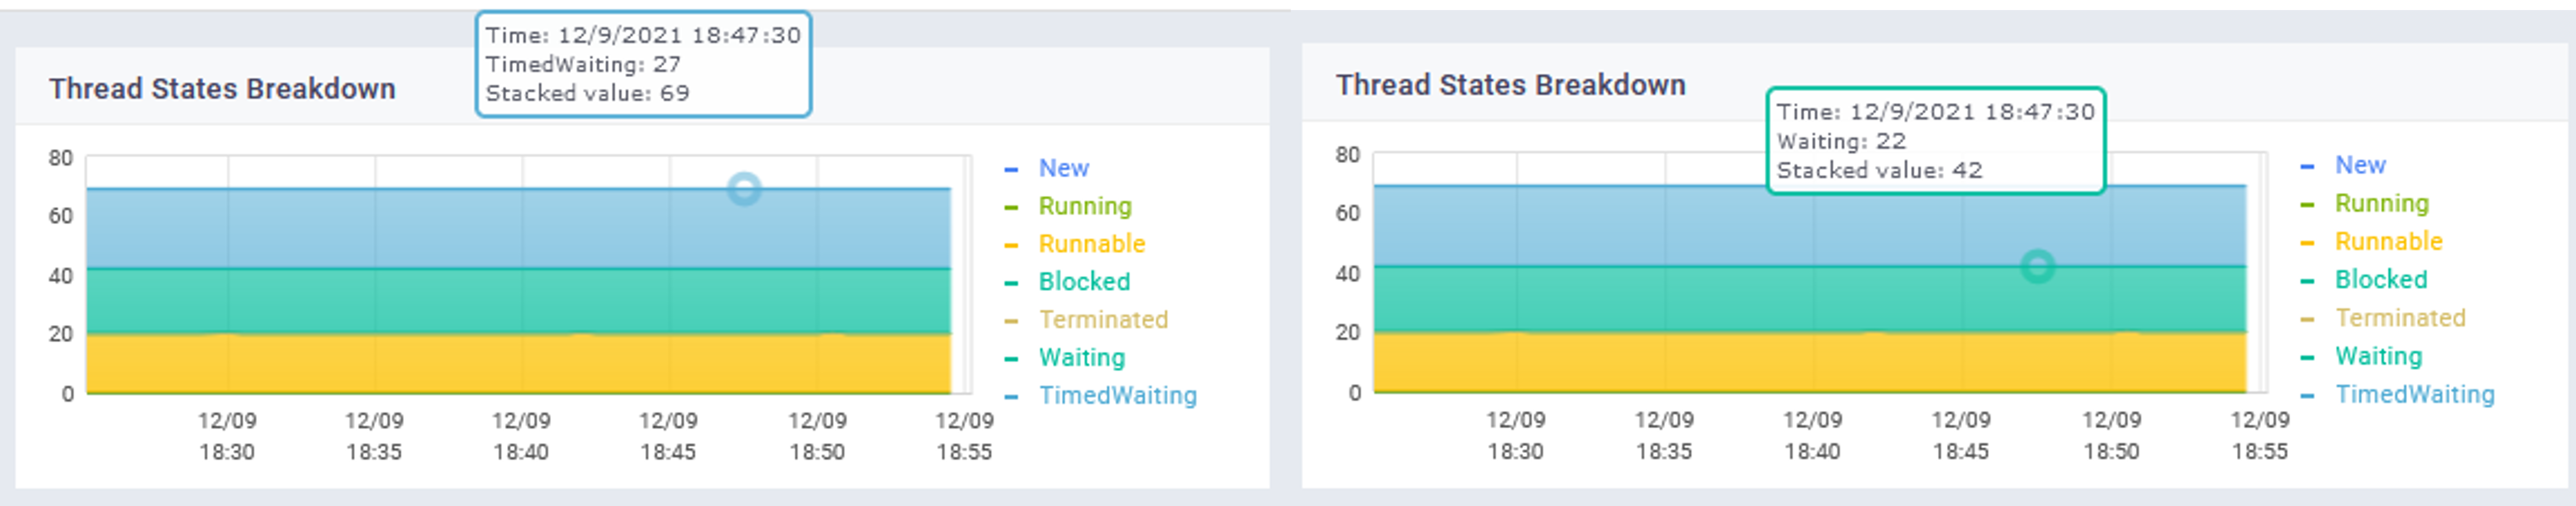
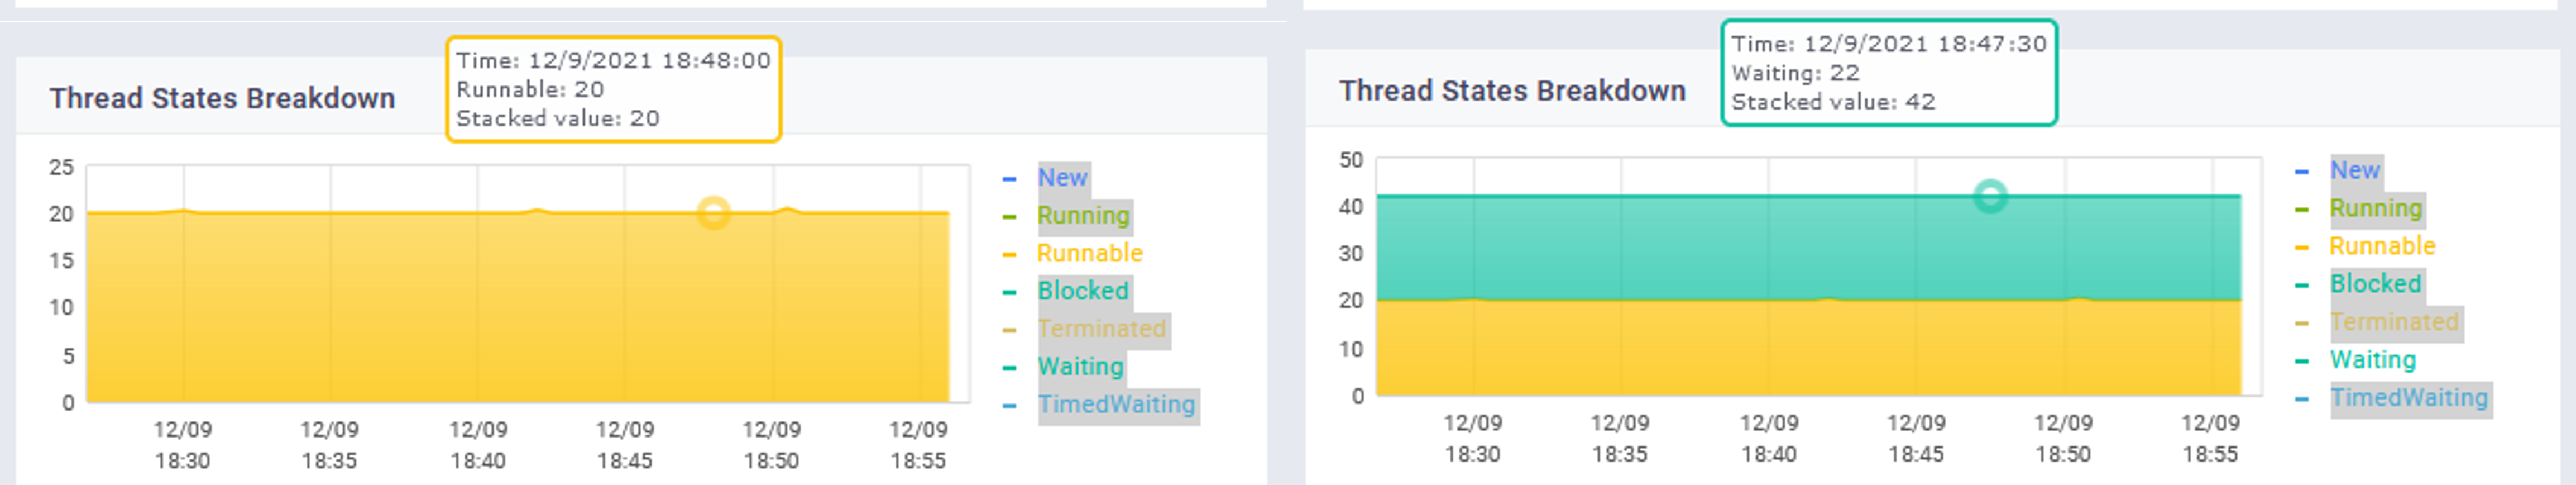
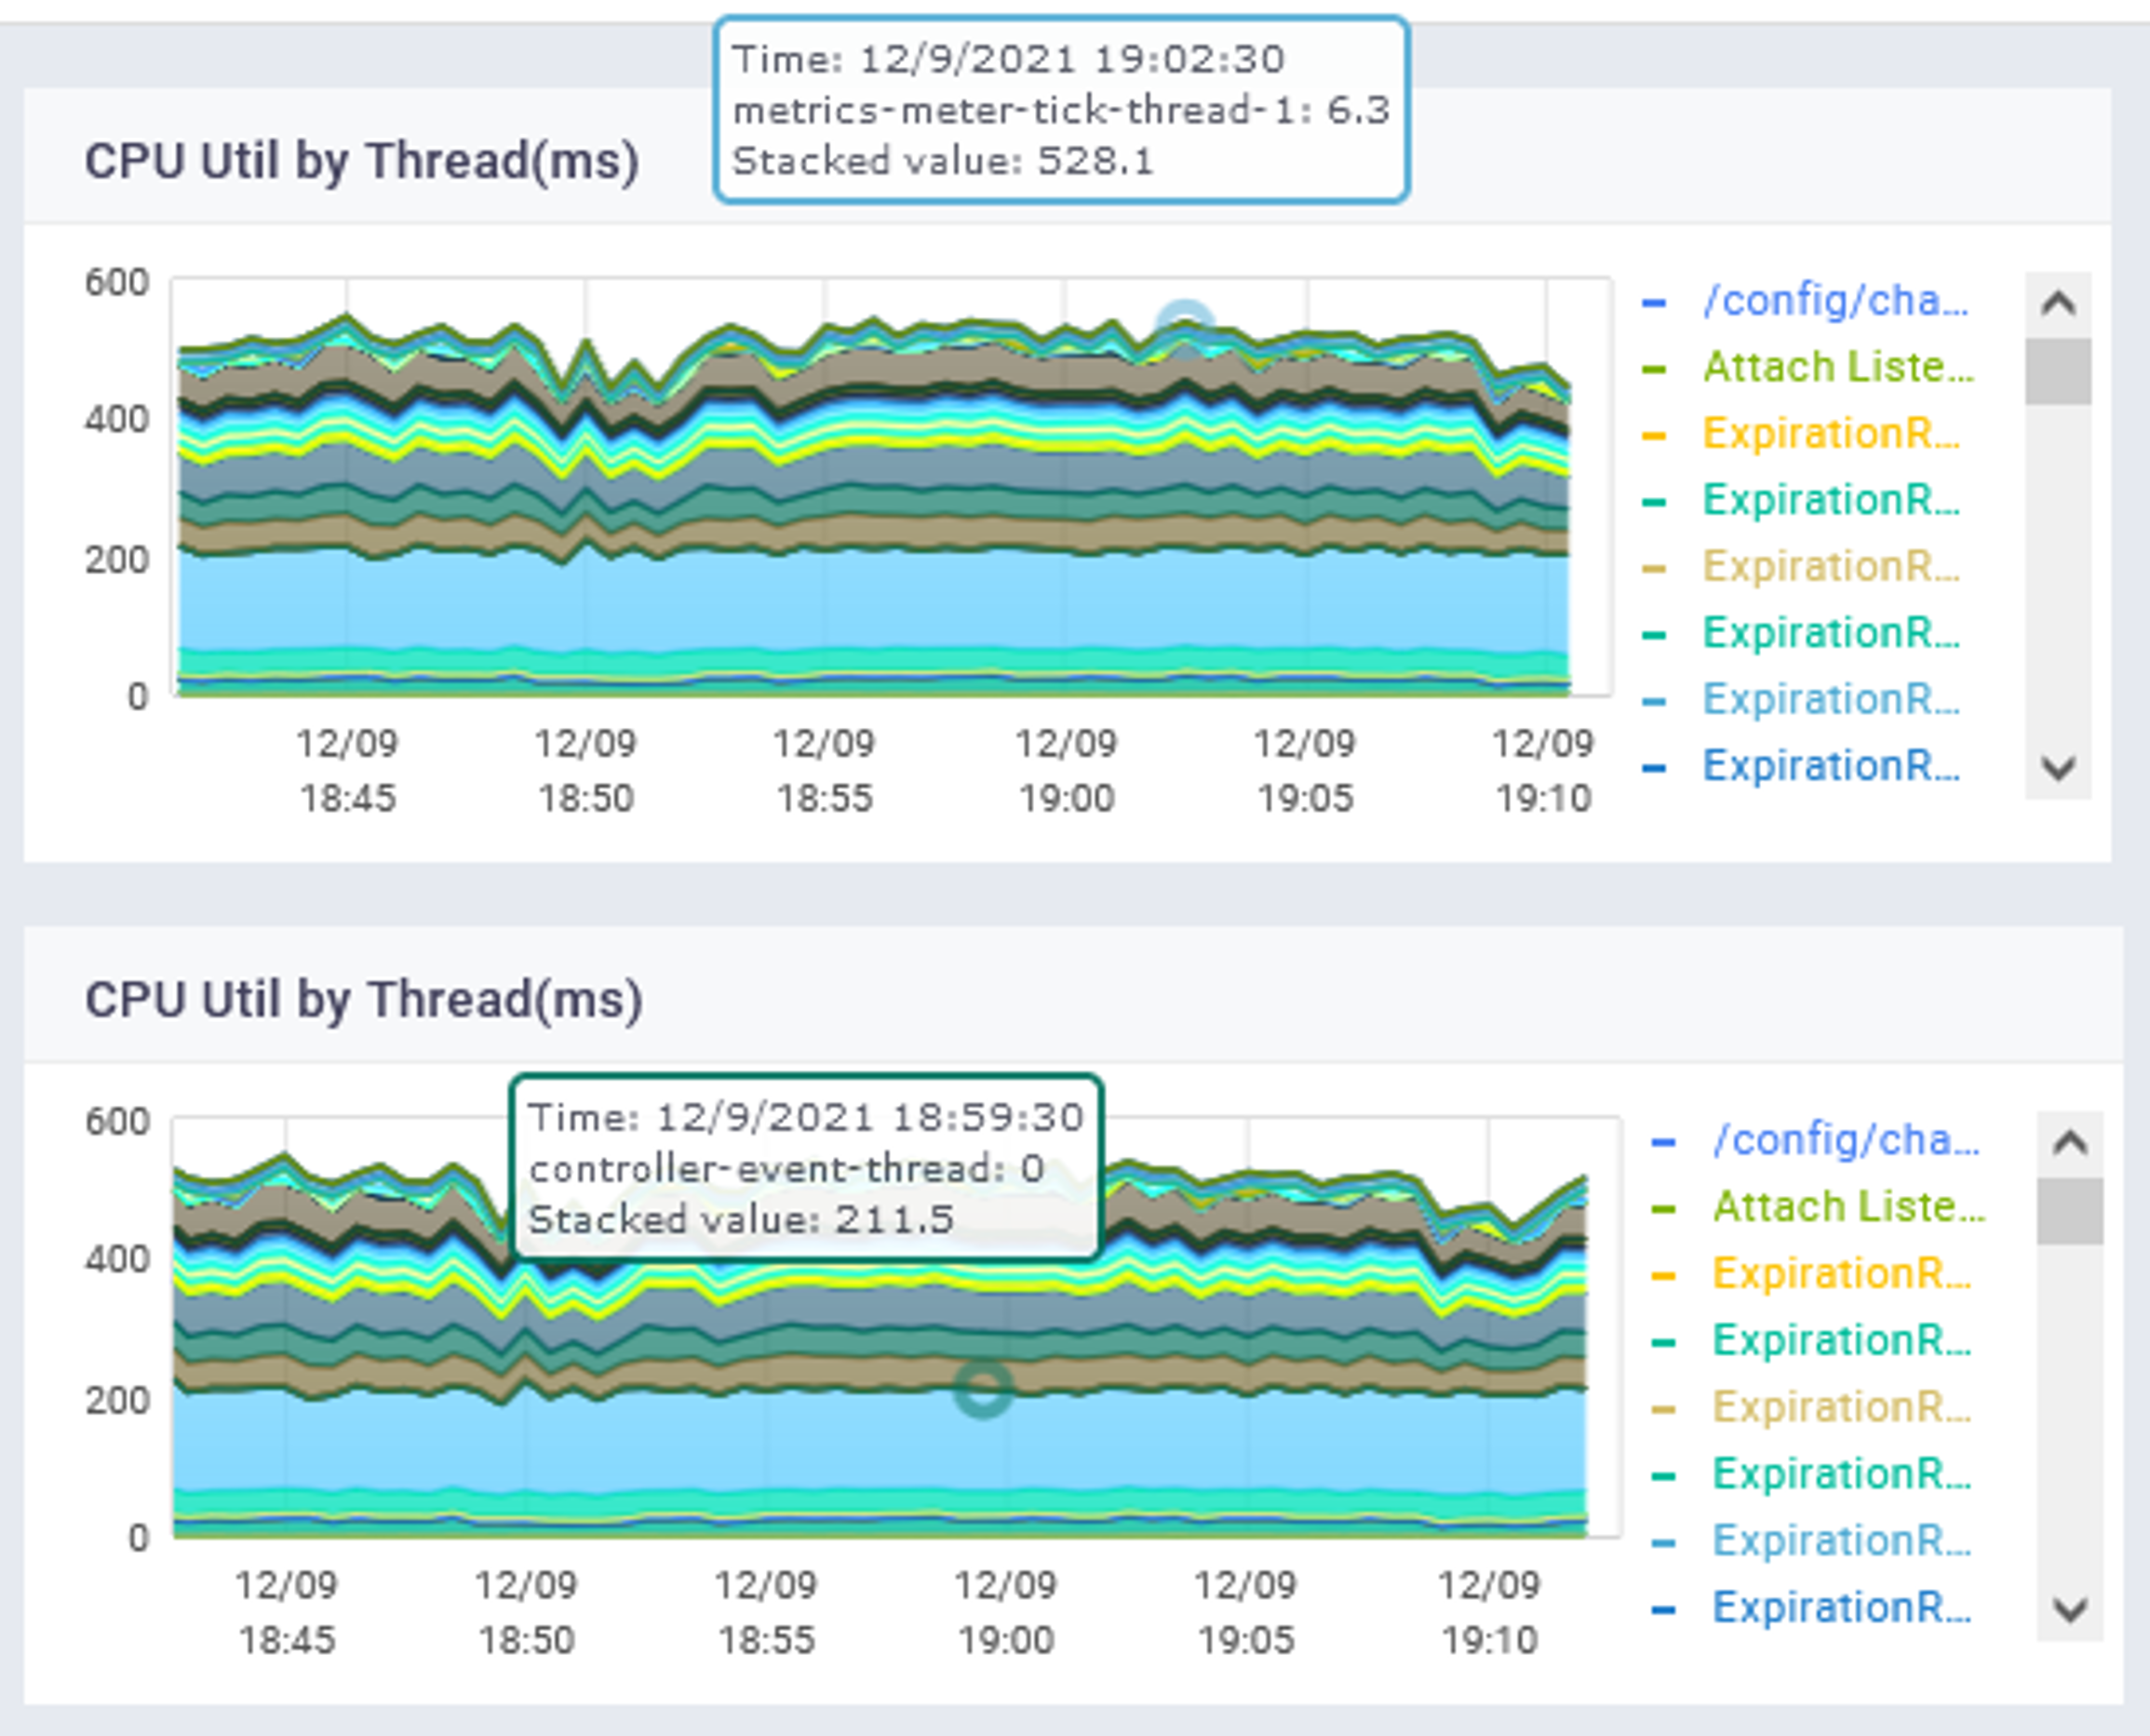
Hover over the graphs to get quick summary about Thread States and CPU Util by Thread.