Java tracing
sfTrace Java Agent automatically instruments APIs, frameworks and application servers. Currently sfTrace supports the following:
Oracle JDK: 7u60+, 8u40+, 9, 10, 11
Open JDK: 7u60+, 8u40+, 9, 10, 11
Spring Web MVC 4.x, 5.x
Spring Boot 1.5+, 2.x supports embedded Tomcat
JAX-RS 2.x
JAX-WS
Tomcat 7.x, 8.5.x, 9.x
Wildfly 8-16
JBoss EAP 6.4, 7.0, 7.1, 7.2
Available Platforms
Supported Trace Features
Below is the list of the supported trace features:
- Distributed Tracing
- Transaction Mapping
- Log Correlation
- Capture request Body from Trace
- Service Map
Instances
Install sfAgent which automatically installs sfTrace agent as well.
Link the application with sfTrace Java Agent
Command Line
Use the following arguments while starting your application using the java -jar command in IDE, Maven or Gradle script:
java -javaagent:/opt/sfagent/sftrace/java/sftrace-java-agent.jar -Dsftrace.service_name=<my-service> -jar <application jar>
If service_name is not provided, an auto discovered service name will be added. Service_name is used to identify and filter the traces related to an application and should be named appropriately to distinctly identify it. Service name must only contain characters from the ASCII alphabet, numbers, dashes, underscores and spaces.
Additional features available for Spring Boot Applications
By default, transaction names of unsupported Servlet API-based frameworks are in the form of $method unknown route. To modify this and to report the transactions names in the form of $method $path, use the following in javaagent configuration. This option is applicable only for spring-boot based applications.
-Delastic.apm.disable_instrumentations=spring-mvc
-Delastic.apm.use_path_as_transaction_name=true
Normalizing Transaction URLs
If your URLs contain path parameters like /user/$userId, it can lead to an explosion of transaction types. This can be avoided by using URL groups.
For example, if the application supports urls like:
/owners, /owners/<owner_id>, /owners/<owner_id>/edit, /owners/<owner_id>/pets,
then url groups would be configured as:
url_groups=/owners/*,/owner/*/edit,/owners/*/pets
Example of running java application via command line using these parameters
java -javaagent:/opt/sfagent/sftrace/java/sftrace-java-agent.jar

-Dsftrace.service_name=my-service
-Delastic.apm.disable_instrumentations=spring-mvc
-Delastic.apm.use_path_as_transaction_name=true
-Delastic.apm.url_groups=/owners/*,/owner/*/edit,/owners/*/pets -jar <application jar>
Apache Tomcat
Add the agent configuration in setenv.sh. If this file is not present, create the file in below folder
<tomcat installation path>/bin
Refer to tomcat_setenv.sh for tracing specific configuration that needs to be copied to setenv.sh file.
Make the file executable using chmod +x bin/tomcat_setenv.sh and start the server
Additional features available for Spring Boot Applications
By default, transaction names of unsupported Servlet API-based frameworks are in the form of $method unknown route. To modify this and to report the transactions names in the form of $method $path, use the following in javaagent configuration. This option is applicable only for spring-boot based applications.
-Delastic.apm.disable_instrumentations=spring-mvc
-Delastic.apm.use_path_as_transaction_name=true
Normalizing Transaction URLs
If your URLs contain path parameters like /user/$userId, it can lead to an explosion of transaction types. This can be avoided by using URL groups. For example, if the application supports urls like:
/owners, /owners/<owner_id>, /owners/<owner_id>/edit, /owners/<owner_id>/pets,
then url groups would be configured as:
url_groups=/owners/*,/owner/*/edit,/owners/*/pets
Example of running java application via command line using these parameters
java -javaagent:/opt/sfagent/sftrace/java/sftrace-java-agent.jar

-Dsftrace.service_name=my-service
-Delastic.apm.disable_instrumentations=spring-mvc
-Delastic.apm.use_path_as_transaction_name=true
-Delastic.apm.url_groups=/owners/*,/owner/*/edit,/owners/*/pets -jar <application jar>
JBOSS EAP
Standalone Mode
Add the agent configuration in standalone.conf file and start the server
Refer to JBOSS_standalone.conf for tracing specific configuration. Copy from section with SFTRACE-CONFIG in comments
Domain Mode
Add the agent configuration in domain.xml and start the server
Refer to JBOSS_domain.xml for tracing specific configuration. Copy from section with SFTRACE-CONFIG in comments
After updating the configuration, restart the application.
Additional features available for Spring Boot Applications
By default, transaction names of unsupported Servlet API-based frameworks are in the form of $method unknown route. To modify this and to report the transactions names in the form of $method $path, use the following in javaagent configuration. This option is applicable only for spring-boot based applications.
-Delastic.apm.disable_instrumentations=spring-mvc
-Delastic.apm.use_path_as_transaction_name=true
Normalizing Transaction URLs
If your URLs contain path parameters like /user/$userId, it can lead to an explosion of transaction types. This can be avoided by using URL groups. For example, if the application supports urls like:
/owners, /owners/<owner_id>, /owners/<owner_id>/edit, /owners/<owner_id>/pets,
then url groups would be configured as:
url_groups=/owners/*,/owner/*/edit,/owners/*/pets
Example of running java application via command line using these parameters
java -javaagent:/opt/sfagent/sftrace/java/sftrace-java-agent.jar

-Dsftrace.service_name=my-service
-Delastic.apm.disable_instrumentations=spring-mvc
-Delastic.apm.use_path_as_transaction_name=true
-Delastic.apm.url_groups=/owners/*,/owner/*/edit,/owners/*/pets -jar <application jar>
Docker
Refer to java_Dockerfile. Look at sections with
SFTRACE-CONFIGdescription.Installation steps are provided. Copy the trace agent to the container and start the container by attaching the agent to the application.
Additionally, user has to add SnappyFlow configurations for
profile_key,projectName,appNameto the docker fileOnce updated, build and start the container.
Kubernetes
Configuration
Make sure that the project and the application are created in the SnappyFlow server. Click here to know how to create a project and an application in SnappyFlow.
sfTrace agent has to run as an initContainer in the application pod. User can deploy this either using a standard deployment yaml or a Helm chart.
Standard Deployment
Add the below configuration to add the sfTrace agent as an initContainer in the application container.
   # deployment.yaml
    initContainers:
    - name: sftrace-java-agent
      image: busybox
      command:
      - sh
      - -c
      - -x
      - wget -O /sfagent/sftrace-agent.tar.gz https://github.com/snappyflow/apm-agent/releases/download/latest/sftrace-agent.tar.gz && cd /sfagent && tar -xvzf sftrace-agent.tar.gz && rm sftrace-agent.tar.gz
      volumeMounts:
      - mountPath: /sfagent
        name: sftrace-agent
Provide the SFTRACE_PROFILE_KEY, SFTRACE_PROFILE_KEY, SFTRACE_PROJECT_NAME , SFTRACE_APP_NAME and the SFTRACE_AGENT path.
        env:
        - name: SFTRACE_PROFILE_KEY
          value: <profile-key>
        - name: SFTRACE_SERVICE_NAME
          value: <service-name>
        - name: SFTRACE_PROJECT_NAME
          value: <project-name>
        - name: SFTRACE_APP_NAME
          value: <app-name>
        - name: SFTRACE_AGENT
          value: -javaagent:/sfagent/sftrace/java/sftrace-java-agent.jar
        - name: ELASTIC_APM_DISABLE_INSTRUMENTATIONS
          value: spring-mvc
        - name: ELASTIC_APM_USE_PATH_AS_TRANSACTION_NAME
          value: "true"
Define a command in the application container and attach sftrace-agent in the application execution command.
     containers:
       - name: sample-java-app
         image: imagename:tag
         command:
         - sh
         - -c
         - java $(SFTRACE_AGENT) -jar jarname
In the
volumeMountssection of your application container add the sftrace-agent mount path which is same as the sfTrace initContainer. in the volumes section, add the sftrace-agent volume mounts.containers:
- name: sample-java-app
image: imagename:tag
volumeMounts:
- mountPath: /sfagent
name: sftrace-agent
volumes:
- name: sftrace-agent
emptyDir: {}
Sample Deployment file
Click here to view the sample applicatideployment yaml file for which the tracing feature is enabled by the configuration mentioned in the above sections.
Helm Chart Deployment
Add the
SF_APP_NAME,SF_PROJECT_NAME, andSF_PROFILE_KEYin thevalues.yamlfile of the helm chart.#values.yaml
global:
# update the sfappname, sfprojectname and key with the proper values
sfappname: <app-name>
sfprojectname: <project-name>
key: <profile-key>
replicaCount: 1
image:
repository: spring-app
pullPolicy: IfNotPresent
tag: "latest"Add the below configuration to add the sfTrace agent as an initContainer in the application container.
   # deployment.yaml
    initContainers:
    - name: sftrace-java-agent
      image: busybox
      command:
      - sh
      - -c
      - -x
      - wget -O /sfagent/sftrace-agent.tar.gz https://github.com/snappyflow/apm-agent/releases/download/latest/sftrace-agent.tar.gz && cd /sfagent && tar -xvzf sftrace-agent.tar.gz && rm sftrace-agent.tar.gz
      volumeMounts:
      - mountPath: /sfagent
        name: sftrace-agent
Provide the SFTRACE_PROFILE_KEY, SFTRACE_PROFILE_KEY, SFTRACE_PROJECT_NAME , SFTRACE_APP_NAME and the SFTRACE_AGENT path.
        env:
        - name: SFTRACE_PROFILE_KEY
          value: {{ .Values.global.key }}
        - name: SFTRACE_SERVICE_NAME
          value: <service-name>
        - name: SFTRACE_PROJECT_NAME
          value: {{ .Values.global.sfprojectname }}
        - name: SFTRACE_APP_NAME
          value: {{ .Values.global.sfappname }}
        - name: SFTRACE_AGENT
          value: -javaagent:/sfagent/sftrace/java/sftrace-java-agent.jar
        - name: ELASTIC_APM_DISABLE_INSTRUMENTATIONS
          value: spring-mvc
        - name: ELASTIC_APM_USE_PATH_AS_TRANSACTION_NAME
          value: "true"
Define a command in the application container and attach sftrace-agent in the application execution command.
     containers:
       - name: sample-java-app
         image: imagename:tag
         command:
         - sh
         - -c
         - java $(SFTRACE_AGENT) -jar jarname
In the
volumeMountssection of your application container add the sftrace-agent mount path which is same as the sfTrace initContainer. in the volumes section, add the sftrace-agent volume mounts.containers:
- name: sample-java-app
image: imagename:tag
volumeMounts:
- mountPath: /sfagent
name: sftrace-agent
volumes:
- name: sftrace-agent
emptyDir: {}
Sample Helm chart deployment
Update values.yaml: Refer to java_k8s_with_helm_chart_values.yaml to configure agent specific properties. Look at sections with SFTRACE-CONFIG description
Update deployment.yaml: Refer to java_k8s_with_helm_chart_deployment.yaml to copy trace agent to the container and start the container by attaching the agent. Look at sections with SFTRACE-CONFIG description
ECS
Fargate
Deploying the SnappyFlow trace agent
If you are using the fargate type, add the following information to the existing task definition where your application docker container is running
Go to the task definitions in ECS page
Select your task definition
Click on create new revision
Under container definitions select the container in which your application docker container is running and it will open edit container window.
In edit container window under the environment section add the below details
- In the entry point text box provided the sh,-c
- In the command text box add the below command which is highlighted
mkdir /sfagent && wget -O /sfagent/sftrace-agent.tar.gz https://github.com/snappyflow/apm-agent/releases/download/latest/sftrace-agent.tar.gz && cd /sfagent && tar -xvzf sftrace-agent.tar.gz && java -javaagent:/sfagent/sftrace/java/sftrace-java-agent.jar -jar applicationjarfile.jarAdd the environmental variables which is required to send the trace data to snappyflow server
Key Value ELASTIC_APM_USE_PATH_AS_TRANSACTION_NAME true ELASTIC.APM.CAPTURE_BODY all SFTRACE_APP_NAME APP_NAME SFTRACE_PROFILE_KEY Profile_key SFTRACE_PROJECT_NAME Project_Name SFTRACE_SERVICE_NAME Service_Name noteSnappyflow trace agent s should not discover the new project, the values which you are providing like app name and project name must and should already be available in the snappyflow APM.
Click on update, it will close the edit container pop up.
Click on create, it will create the new revision for your task definition
Once the new revision is completed, follow the below steps to update your service in the cluster.
- Navigate to the cluster
- Select the cluster
- Select the service
- Click on the update service, it will open the update service page
- Under the configure service select the task definition with latest revision
- Click on the force new deployment
- Click on the next step and finally click on the update service.
- Once the tasks are running under the service, trigger the request in your application and you will see the traces in SnappyFlow APM
Capture Request Body from Trace
This feature allows you to save the request body of the HTTP transactions to a specific index such as a log.
Request bodies usually contain sensitive data like passwords and credit card numbers. If your service handles data like this, we advise you to enable this feature with care.
Configuration
If you packaged application as a jar file, add the following properties while running the jar file.
- Add the below properties to enable this feature.
-Delastic.apm.global_labels="_tag_redact_body=true"
-Delastic.apm.capture_body=all - Add the below properties to customize the document type and destination index. (Optional)
# default indexType is log, applicable values are log and metric
-Delastic.apm.global_labels="_tag_redact_body=true,_tag_IndexType=log"
# default documentType is user-input
-Delastic.apm.global_labels="_tag_redact_body=true,_tag_documentType=custom-document"
After adding the above properties the command looks like:
java -Delastic.apm.capture_body=all -Delastic.apm.global_labels="_tag_redact_body=true,_tag_IndexType=log,_tag_documentType=custom-document" -jar (application jar name)- Add the below properties to enable this feature.
If you packaged application as a war file, add the following properties in the
tomcat_setenv.shfile.Add the below properties to enable this feature.
export CATALINA_OPTS="$CATALINA_OPTS  -Delastic.apm.global_labels='_tag_redact_body=true'"
export CATALINA_OPTS="$CATALINA_OPTS  -Delastic.apm.capture_body=all'
Add the below properties to customize the document type and destination index. (Optional)
# default indexType is log, applicable values are log and metric
export CATALINA_OPTS="$CATALINA_OPTS -Delastic.apm.global_labels='_tag_IndexType=log'"
# default documentType is user-input
export CATALINA_OPTS="$CATALINA_OPTS -Delastic.apm.global_labels='_tag_documentType=custom-document'"
After adding the above properties the file looks like:
export CATALINA_OPTS="$CATALINA_OPTS -Delastic.apm.capture_body=all'
export CATALINA_OPTS="$CATALINA_OPTS -Delastic.apm.global_labels='_tag_redact_body=true,_tag_IndexType=log,_tag_documentType=custom-document'"
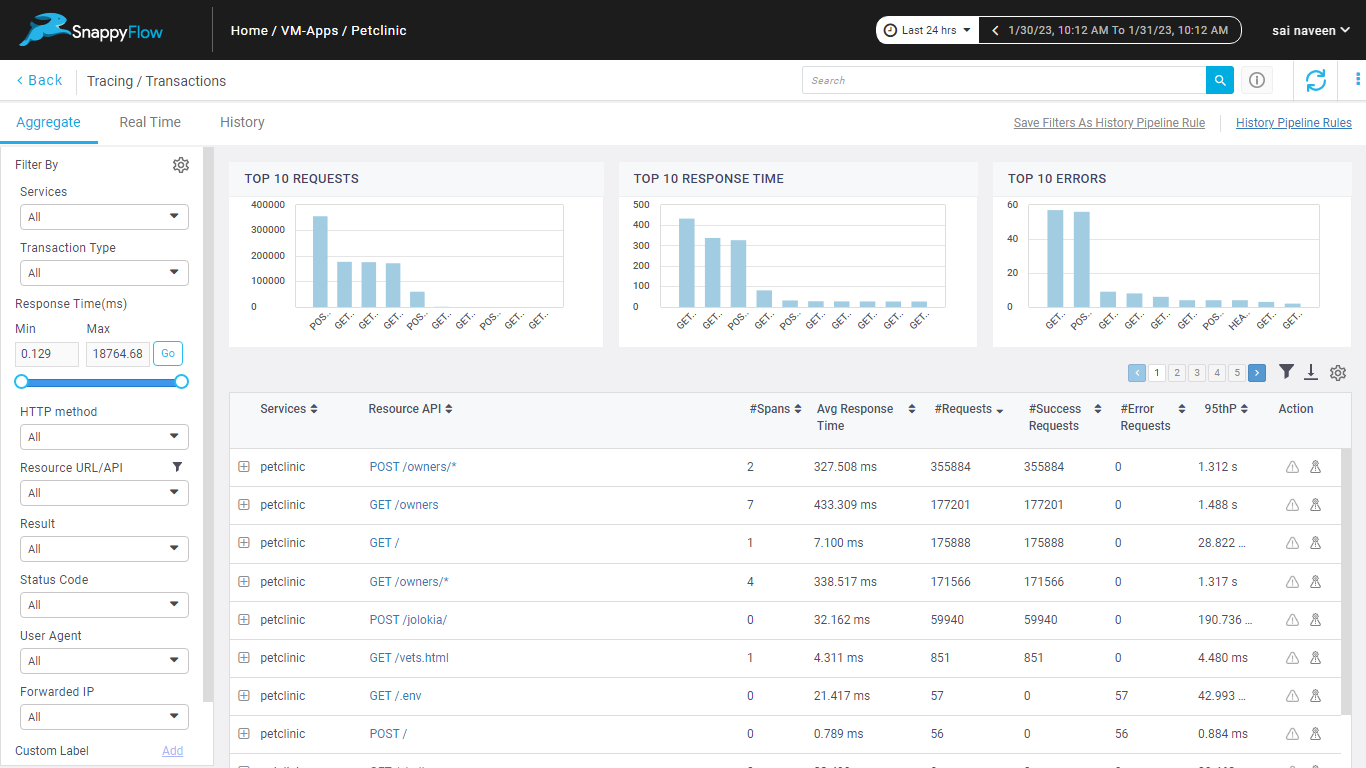
Verification
In the app, click the View Dashboard icon.
If you provided the index type is log:
a. In the Dashboard window, go to Logs section.
b. In the Overview windows, select the Source and Log Type.
c. Now you can view the logs in the dashboard.
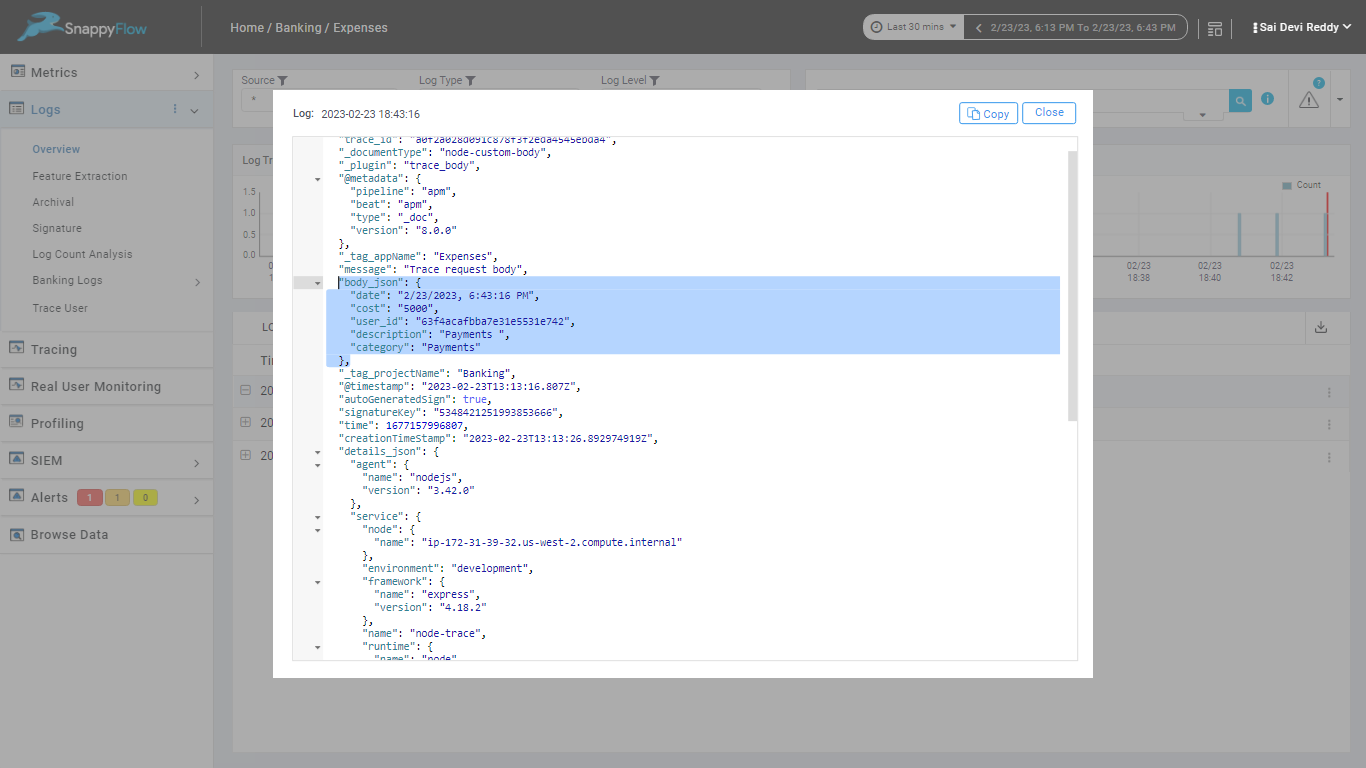
If you provided the index type as metric:
a. In the Dashboard window, go to Browse Data section.
b. select the plugin as trace_body and document type.
c. Now you can view the logs in the dashboard.
Log Correlation
log correlation refers to the ability to linking log events from different sources, applications or components of a system to gain a holistic understanding of the system's behavior. When logs are captured, they are automatically correlated with the relevant transaction and span information. This correlation is done based on the shared context information, such as the transaction ID or the span ID.
For example, when an error occurs in an application, SnappyFlow APM capture the error stack trace and link it to the relevant transaction or span. This provides context around the error and helps developers understand which part of the application was responsible for the error.
Configuration
Create a file with name
logback.xmlin your applicationsrc/main/resourcesfolder.Add the Following lines of configuration and provide the log file path.
<?xml version = "1.0" encoding = "UTF-8"?>
<configuration>
   <appender name = "FILE" class = "ch.qos.logback.core.FileAppender">
      <!-- Add path for your log file eg. -->
      <File>/var/log/spring-app.log </File>
      <encoder>
         <pattern> [%d{yyyy-MM-dd'T'HH:mm:ss.sss'Z'}] [%-2p] [%m] | elasticapm transaction.id=%X{transaction.id} trace.id=%X{trace.id} span.id=None %n </pattern>
      </encoder>
   </appender>
   <root level = "INFO">
      <appender-ref ref = "FILE"/>
   </root>
</configuration>
Add logging statements to your application code through a logging framework such as Logback or Log4j. This will typically involve configuring a logging appender that sends log messages to the specified path. For example:
package org.springframework.samples;
import org.slf4j.Logger;
import org.slf4j.LoggerFactory;
class CustomController {
  Logger logger = LoggerFactory.getLogger(CustomController.class);

  @GetMapping("/getCustomer")
  public void getCustomer() {
    logger.info("Query success called GET /getCustomer");
  }
}
Build your application and Add the below property.
Your application is packaged as a jar file, then add the
elastic.apm.enable_log_correlationproperty like below while running your application jar.For Example:
java -Delastic.apm.enable_log_correlation=true -jar applicationjar.jarThe Overall Configuration after enable the tracing, Capture request Body from Trace and log correlation:
java -javaagent:/opt/sfagent/sftrace/java/sftrace-java-agent.jar
-Dsftrace.service_name=spring-service
-Delastic.apm.disable_instrumentations=spring-mvc
-Delastic.apm.use_path_as_transaction_name=true
-Delastic.apm.transaction_ignore_urls=/jolokia/*
-Delastic.apm.enable_log_correlation=true
-Delastic.apm.capture_body=all
-Delastic.apm.global_labels="_tag_redact_body=true,_tag_IndexType=log,_tag_documentType=custom-document"
-jar <application jar>
you application is packaged as a war file, add the
elastic.apm.enable_log_correlationproperty in thetomcat_setenv.shfile.For Example:
export CATALINA_OPTS="$CATALINA_OPTS -Delastic.apm.enable_log_correlation=true"The Overall Configuration after enable the tracing, Capture request Body from Trace and log correlation:
export CATALINA_OPTS="$CATALINA_OPTS -javaagent:/opt/sfagent/sftrace/java/sftrace-java-agent.jar"
export CATALINA_OPTS="$CATALINA_OPTS -Dsftrace.apm.service_name=custom-service"
export CATALINA_OPTS="$CATALINA_OPTS -Delastic.apm.disable_instrumentation=spring-mvc"
export CATALINA_OPTS="$CATALINA_OPTS -Delastic.apm.use_path_as_transaction_name=true"
export CATALINA_OPTS="$CATALINA_OPTS -Delastic.apm.enable_log_correlation=true"
export CATALINA_OPTS="$CATALINA_OPTS -Delastic.apm.capture_body=all"
export CATALINA_OPTS="$CATALINA_OPTS -Delastic.apm.global_labels='_tag_redact_body=true,_tag_IndexType=log,_tag_documentType=custom-document'"
Steps to send log correlation data to SnappyFlow APM
Instance
Add the elasticApmLog plugin under logging section in the sfagent config.yaml file.
For Example:
key: <SF_PROFILE_KEY>
tags:
Name: <any-name>
appName: <SF_APP_NAME>
projectName: <SF_PROJECT_NAME>
logging:
plugins:
   - name: elasticApmTraceLog
      enabled: true
      config:
         log_level:
            - error
            - warning
            - info
         # Your app log file path
         log_path: /var/log/spring-app.log
Verification
To view the logs
- In the app, click the View Dashboard icon.
- In the Dashboard window, go to Logs section.
- Select the logType as elasticApmTraceLog
- Now you can view the logs in the dashboard.
Kubernetes
Follow the below steps to send the correlated logs data to SnappyFlow from the application running in the Kubernetes cluster.
Helm chart deployment
Configuration
To download the sfKubeAgent image, add the following configuration in the
values.yamlfile.# values.yaml
sfagent:
enabled: true
image:
repository: snappyflowml/sfagent
tag: latest
pullPolicy: Always
resources:
limits:
cpu: 50m
memory: 256Mi
requests:
cpu: 50m
memory: 256MiCreate a
sfagent-configmap.yamlfile in the template folder of the Helm Chart. Then add theelasticApmTraceLoglogger plugin.Sample configuration:
# sfagent-configmap.yaml
{{- if .Values.sfagent.enabled }}
apiVersion: v1
kind: ConfigMap
metadata:
  name: {{ include "<chart-name>.fullname" . }}-sfagent-config
  labels:
     {{ default "snappyflow/appname" .Values.global.sfappname_key }}: {{ default .Release.Name .Values.global.sfappname }}
     {{ default "snappyflow/projectname" .Values.global.sfprojectname_key }}: {{ default .Release.Name .Values.global.sfprojectname }}
data:
  config.yaml: |+
    ---
    key: "{{ .Values.global.key }}"
    logging:
       plugins:
       - name: elasticApmTraceLog
         enabled: true
         config:
           log_path: <log-path location>
{{- end }}
Add the sfKubeAgent as a container in the existing
deployment.yamlfile.Sample configuration:
  {{- if .Values.sfagent.enabled }}
- name: sfagent
  image: "{{ .Values.sfagent.image.repository }}:{{ .Values.sfagent.image.tag }}"
  imagePullPolicy: "{{ .Values.sfagent.image.pullPolicy }}"
  command:
     - /app/sfagent
     - -enable-console-log
  env:
    - name: APP_NAME
      value: "{{ .Values.global.sfappname }}"
    - name: PROJECT_NAME
      value: "{{ .Values.global.sfprojectname }}"
  resources:
    {{ toYaml .Values.sfagent.resources | nindent 12 }}
In the
volumeMountssection of your application container and sfkubeagent container, add the log location path as a shared folder location. Then, in thevolumessection, add the log correlation andsfagent-configvolume mounts.Sample configuration:
containers:
  - name: {{ .Chart.Name }}
    image: "{{ .Values.image.repository }}:{{ .Values.image.tag }}"
    imagePullPolicy: {{ .Values.image.pullPolicy }}
    volumeMounts:
      - name: log-correlation
        mountPath: <mount path ex:/var/log>
    {{- if .Values.sfagent.enabled }}
  - name: sfagent
    image: "{{ .Values.sfagent.image.repository }}:{{ .Values.sfagent.image.tag }}"
    imagePullPolicy: "{{ .Values.sfagent.image.pullPolicy }}"
    volumeMounts:
      - name: log-correlation
        mountPath: <mount path ex:/var/log>
      - name: sfagent-config
        mountPath: /opt/sfagent/config.yaml
        subPath: config.yaml
volumes:
  - name: log-correlation
    emptyDir: {}
  - name: sfagent-config
    configMap:
      name: {{ include "<helm-chart name>.fullname" . }}-sfagent-config
Verification
To view the logs:
- Login into SnappyFlow.
- Go to the Application tab.
- In the Application tab, navigate to your Project > Application.
- Click the Application's Dashboard icon.
- In the Dashboard window, go to the Logs section.
- Select the logType as
elasticApmTraceLog. - You can view the logs in the dashboard.